Business diagrams represent your business processes in a visual way. Also called business process mapping, these tools show the steps involved in your procedures. Used for anything from production processes to employee onboarding, business diagrams clearly map out everything involved in your operations.
Here are 50 such diagrams and templates that you can use.
Brainstorming
Affinity Diagrams


What is an Affinity Diagram?
An affinity diagram is a visual tool used for organizing ideas or information generated during brainstorming sessions. It helps teams make sense of large amounts of unstructured information by grouping related ideas together and identifying patterns and themes.
When to Use
- Grouping and categorizing ideas.
- Making sense of complex information.
- Generating insights from a brainstorming session.
- Resolving issues collaboratively.
- Organizing unstructured data.
- Improving processes through team input.
How to Use the Affinity Diagram
- Gather ideas: Write down ideas or opinions related to a specific topic or problem on separate cards or sticky notes.
- Sort similar ones: Stick the notes on a board, moving similar ones close to each other.
- Label groups: Write a descriptive label or heading for each group that captures the overarching theme that ties those ideas together.
- Analyze and refine: Analyze the relationships and patterns that emerge.
- Discuss and prioritize: Discuss about the identified groups and their contents to develop strategies, solutions, or action plans based on them.
Additional Resources
Decision Tree

What is a Decision Tree?
A decision tree template is a visual aid that helps you make decisions by breaking down a complex problem into smaller, more manageable steps. The template typically consists of a central node, which represents the main decision to be made, and branches that represent the possible outcomes of that decision. Each branch can then have its own sub-branches, representing the possible outcomes of the next decision, and so on.
When to Use:
- Evaluating possible outcomes and their probabilities.
- Quantifying risks and rewards.
- Structuring decision-making logically.
- Analyzing trade-offs and uncertainties.
- Communicating decision paths visually.
How to Use it in 4 Simple Steps
- Clearly outline the decision you need to make. Is it a business strategy, project path, or personal choice? It helps to lay the foundation for an effective decision-making process.
- List the viable options at hand. These are the potential branches of your decision tree, representing different pathways to consider.
- For each option, assess the potential outcomes and consequences. Use data, research, and expert insights to weigh the pros and cons, allowing you to make an informed choice.
- Once you’ve evaluated all options, follow the branches to their logical conclusions. The Decision Tree Template will lead you to the optimal choice, backed by an analysis of potential outcomes.
Additional Resources
Mind Map

What is a Mind Map?
A mind map is a visual representation of information that helps organize thoughts, ideas, concepts, or tasks around a central topic or theme. It typically starts with a central idea or keyword, which branches out into related subtopics, creating a tree-like structure. Each subtopic can further branch out into more specific details. Mind maps use keywords, images, colors, and connections to create a visually engaging overview of information.
When to Use
- Brainstorming creatively.
- Planning projects or tasks.
- Visualizing relationships.
- Taking structured notes.
- Problem-solving collaboratively.
How to Create a Mind Map?
- Central idea: Start with a central keyword or topic in the middle of the page.
- Branches: Create main branches radiating from the central idea, each representing a key subtopic or category.
- Sub-branches: From each main branch, add smaller branches for more specific details or ideas related to the subtopic.
- Keywords and images: Use concise keywords and images on each branch to represent concepts. Keep text short and visual.
- Hierarchy: Arrange branches in a hierarchical manner, with main topics closer to the center and subtopics farther out.
- Connections: Draw lines or arrows to show connections between related branches, indicating relationships or dependencies.
Additional Resources
- Mind Mapping Software
- Mind Map Examples to Visualize Your Ideas
- How to Use Mind Maps for Perfect Elevator Pitch
- How Mind Maps Increase Productivity & Save Time
- How to Use Mind Maps Effectively in a Meeting
- Mind Maps for Effective Business Thinking
SCAMPER Template

What is a SCAMPER Template?
The SCAMPER template is a brainstorming tool that allows you to generate ideas and transform them into tangible solutions. Each letter in the acronym prompts a specific angle for idea generation:
Substitute: Identify elements that can be replaced to enhance the concept.
Combine: Fuse different ideas to create something entirely new and exciting.
Adapt: Modify aspects to suit a different context or purpose.
Modify: Alter and refine components to boost functionality and appeal.
Put to Another Use: Imagine alternate applications for existing concepts.
Eliminate: Trim unnecessary elements to streamline and refine the idea.
Reverse/Rearrange: Flip perspectives and arrangements for fresh insights.
When to Use:
- Generating new ideas or solutions.
- Overcoming creative blocks.
- Innovating existing concepts.
- Reframing problems for fresh perspectives.
- Enhancing products or processes.
How to Use the SCAMPER Template?
- Identify the concept or idea you want to explore. Frame it as a question or challenge.
- Apply the SCAMPER principles – Substitute, Combine, Adapt, Modify, Put to another use, Eliminate, and Reverse – to dissect your concept. This sparks inventive ideas by prompting you to view them from various angles.
- Engage with the generated ideas. Identify the most promising ones and refine them further. Combine different SCAMPER techniques for a synergy of creativity.
- Organize your ideas visually using the SCAMPER Map template. This clear overview of your innovative pathways helps you choose the best direction forward.
Additional Resources
- The Best Ideation Techniques for Remote Teams
- The Ultimate List of Visual Creative Thinking Techniques for Your Next Great Idea
- SCAMPER Examples
Documentation
Business Process Modeling Notation (BPMN)

What is BPMN?
Business Process Modeling Notation (BPMN) is a standardized graphical notation used to visualize business processes in a clear and understandable way. It provides a visual representation of various aspects of a business process, including its activities, decisions, events, gateways, and flows, allowing organizations to model, analyze, and communicate their processes effectively.
When to Use
- Documenting business processes.
- Representing workflow logic.
- Analyzing process efficiency.
- Standardizing process documentation.
How to Create a BPMN Diagram?
- Identify the process: Choose the specific business process you want to model.
- List process steps: Break down the process into individual steps, from start to finish.
- Draw the BPMN diagram: Using the correct notations, draw the BPMN diagram.
- Connect symbols: Use arrows to connect the symbols in the sequence they occur.
- Add information: Inside the symbols, add details like task names, who’s responsible, and any important data. This provides clarity and context.
- Use swimlanes: If different teams or roles are involved, use swimlanes to show responsibilities.
Additional Resources
- BPMN Software
- BPMN Templates to Model Business Processes
- Business Process Modeling Techniques
- 5 Tips to Master Business Process Modeling
- What is Business Process Modeling
- Importance of Business Process Modeling
Employee Journey Map

What is an Employee Journey Mapp?
The employee journey map is a tool that helps visualize an employee’s progression within an organization, from hire to exit. It aims to add value to the employee by identifying his/her skills, areas of expertise and improvement to create growth opportunities accordingly. It gives employees a clear picture of what their journey will be like in the company.
In addition, the employee journey maps gauge employee satisfaction throughout important phases such as “Onboarding” to “Growth,” “Transitions,” and “Offboarding,” delving into their emotions, needs, and aspirations.
When to Use
- Analyzing employee experiences.
- Visualizing the employee lifecycle.
- Identifying pain points and opportunities.
- Improving employee engagement.
- Mapping touchpoints and interactions.
How to Use the Employee Journey Map Template?
- Assemble key stakeholders to pool insights, ensuring a holistic perspective.
- Identify employee personas to empathize with distinct experiences.
- Plot employee interactions, pain points, and delights within each phase.
- Continuously refine by analyzing feedback, adapting strategies, and nurturing ongoing improvements.
Additional Resources
- Org Chart Software
- Organizational Chart Examples
- 7 Types of Organizational Structures
- Organizational Chart Best Practices
- Manage your Project Better with Org Charts
- Manage Your Company’s Growth with Org Charts
Organizational Chart

What is an Organizational Chart?
An organizational chart, also known as an org chart or hierarchy chart, is a visual representation of a company’s structure that highlights the relationships between different roles, positions, and departments within the organization.
When to Use
- Showing reporting relationships.
- Illustrating departmental divisions.
- Understanding roles and positions.
- Onboarding new employees.
- Planning for growth or restructuring.
How to Create an Organizational Chart?
- Identify roles and departments: List all key roles and departments within the organization, from top-level executives to lower-level positions.
- Hierarchy arrangement: Determine the hierarchy of positions, including reporting relationships. Place higher-ranking roles at the top and follow down with subordinates..
- Chart format: Choose a suitable format, such as a hierarchical structure with boxes and lines, for your chart.
- Add positions: Use boxes for each role and connect them with lines to indicate reporting relationships. Align boxes to show hierarchy levels clearly.
- Position details: Include job titles, names (if applicable), and a brief description of each role within the boxes.
- Review and refine: Double-check the chart for accuracy, clarity, and alignment with the organization’s structure. Make adjustments as needed, ensuring the chart clearly reflects the current hierarchy and roles.
Additional Resources
- Org Chart Software
- Organizational Chart Examples
- 7 Types of Organizational Structures
- Organizational Chart Best Practices
- Manage your Project Better with Org Charts
- Manage Your Company’s Growth with Org Charts
Service Blueprint

What is a Service Blueprint?
A service blueprint is a diagram that illustrates the end-to-end customer service experience, along with the internal processes, interactions, and touchpoints that support it. It provides a comprehensive view of how a service is delivered, highlighting the customer’s journey, the roles of various stakeholders, and the behind-the-scenes activities required to deliver the service effectively.
When to Use
- Analyzing service delivery gaps.
- Enhancing service quality and efficiency.
- Enhancing customer experiences.
- Collaborating on service design.
- Designing or improving services.
How to Create a Service Blueprint?
- Define the service: Clearly identify the specific service you want to blueprint, specifying its scope and purpose.
- Map the customer journey: Outline the steps a customer takes when interacting with the service, including touchpoints and key actions.
- Identify internal processes: Map out the internal activities and processes that support each customer touchpoint, showing how the service is delivered behind the scenes.
- Add backstage & support processes: Show the backstage processes, such as employee training, resource allocation, quality control, etc. required to deliver the service.
- Validate and refine: Share the blueprint with stakeholders, including team members and customer representatives, to ensure its accuracy and gather feedback for refinement.
Additional Resources
SIPOC Diagram

What is a SIPOC Diagram?
A SIPOC diagram is used in business process improvement to outline the high-level components of a process. The acronym SIPOC stands for Suppliers, Inputs, Process, Outputs, and Customers. Each element in the SIPOC diagram provides a clear overview of the process and its relationships to help teams understand and analyze a process in a structured manner.
When to Use
- Defining process scope.
- Identifying key process elements.
- Communicating process overview.
- Analyzing process components.
- Streamlining process understanding.
How to Create a SIPOC Diagram?
- Define the process: Choose the specific process you want to map.
- Identify suppliers: List the entities or sources that provide essential inputs or resources to initiate the process.
- List inputs: Specify the materials, information, or resources required from the suppliers to start and execute the process.
- Outline the process: Define the key steps involved in the process, highlighting the sequence of actions.
- List outputs: Identify the end results or deliverables produced by the process, ensuring they meet the needs of the customers.
- Identify customers: Determine who receives the outputs and understand their requirements or expectations from the process.
Additional Resources
Value Stream Map

What is a Value Stream Map?
A value stream map (VSM) is a diagram that visualizes the entire process of how a product or service is produced or delivered, from the raw materials or inputs to the end customer. It provides a comprehensive overview of the flow of materials, information, and activities within a process or system. Value stream mapping is often used in Lean and Six Sigma methodologies to identify inefficiencies, eliminate waste, and optimize processes.
When to Use
- Analyzing process efficiency.
- Identifying bottlenecks and waste.
- Improving workflow and cycle time.
- Visualizing end-to-end processes.
- Streamlining operations.
How to Create a Value Stream Map?
- Select the process: Choose the process or system you want to map-production process, service delivery, etc..
- Gather information: Collect data on process steps, times, inventory, and metrics.
- Draw current map: Visualize the current process steps and flow using the value stream map symbols.
- Differentiate steps: Identify which steps add value and which don’t, marking non-value-adding ones.
- Map inventory & identify bottlenecks: Show where materials pile up and where work is in progress. Highlight parts causing slowdowns or problems.
- Calculate metrics: Add details like how long each step takes and how much time passes between steps.
- Draw the future state map : Create a future state map that depicts the improved process, incorporating changes and optimizations.
Additional Resources
Meetings
Retrospective Meeting Template

What is a Retrospective Meeting?
A retrospective meeting template is a structured format used to conduct retrospective meetings, also known as “retros” or “post-mortems.” They are effective team gatherings held at the end of a project, sprint, or time period, where participants reflect on what went well, what could be improved, and how to improve future processes.
When to Use
- Reviewing past project phases.
- Reflecting on team performance.
- Discussing lessons learned.
- Improving teamwork and processes.
- Planning actionable improvements.
How to Run a Retrospective Meeting?
- Set the stage: Begin by introducing the purpose of the retrospective and the context, such as the project, sprint, or time period being reviewed.
- Gather data: Collect information and metrics related to the project’s performance, including successes, challenges, and relevant user feedback.
- Review: Facilitate a discussion where team members share what went well and what didn’t go as planned, ensuring a balanced perspective.
- Brainstorm solutions: Encourage the team to brainstorm potential improvements and solutions for the identified challenges. Focus on actionable items that can be implemented in the future.
- Prioritize action items: Collaboratively prioritize the suggested solutions based on their impact and feasibility, selecting a few key action items for the team to work on.
Additional Resources
- Retro Software
- The Ultimate Guide to Retrospectives
- Guide to Running Retrospectives Remotely
- Fun Retrospective Ideas for Hybrid Teams
- 10 Common Mistakes to Avoid During Retrospectives
- 54 Retrospective Questions
Project Management
Action Plan

What is an Action Plan?
An action plan is a detailed document that outlines the specific steps, tasks, resources, timelines, and responsibilities required to achieve a particular goal or objective. It serves as a roadmap, guiding individuals or teams through the implementation of strategies, projects, or initiatives.
When to Use
- Breaking down goals into steps.
- Tracking progress and completion.
- Organizing complex projects.
- Ensuring accountability.
- Facilitating effective execution.
How to Create an Action Plan?
- Set clear objectives: Clearly define the specific goal or objective you want to achieve. Make it measurable, achievable, relevant, and time-bound (SMART).
- Break it down: Divide the objective into smaller, manageable tasks or steps that contribute to the overall goal. These tasks should be clear and actionable.
- Assign responsibilities: Identify who is responsible for each task. Assign roles to individuals or teams based on their expertise and availability.
- Set timelines: Determine realistic deadlines for each task. Ensure the timeline aligns with the overall objective and consider any dependencies between tasks.
- Allocate resources: Identify the resources required to complete each task, such as personnel, budget, materials, or tools.
Additional Resources
- How to Create an Action Plan
- Action Plan Examples
- Corrective Action Plan
- Employee Engagement Action Plan
Communications Plan

What is a Communications Plan?
A communications plan is a document that outlines how you will communicate with potential customers. It should include information about your goals for communication, target audience, key messages, timeline of communications, communications budget, channels that you will use to communicate and KPIs to measure success of your communications.
When to Use
- Launching a new product or service.
- Managing project or campaign communication.
- Defining target audiences and stakeholders.
- Outlining communication objectives and goals.
- Establishing timelines and responsibilities.
- Aligning communication efforts with strategy.
How to Use the Communications Plan?
- Clearly mention your goals. Whether it’s brand promotion, event awareness, or crisis management, this sets the tone.
- Understand your audience. What drives them? How can your message create impact?
- Craft messages that caters to each audience segment. Choose the optimal channels for maximum reach and engagement.
- Set a realistic timeline, coordinate teams, and execute with precision.
Additional Resources
Lessons Learned Template

What is the Lessons Learned Template?
A lessons learned template is a document that helps project teams document the knowledge obtained from executing a project. It includes both positive and negative experiences that occurred throughout the project. The template typically covers the following topics: what went well, what went wrong, what could have been done better, and any valuable lessons that can be taken away.
When to Use
- Capturing successes and challenges.
- Identifying what went well and what didn’t.
- Documenting best practices and pitfalls.
- Improving future project planning.
- Sharing knowledge within the organization.
How to Use the Lessons Learned Template?
- Engage stakeholders in candid post-project assessments. Encourage open dialogue about successes, failures, and unexpected outcomes. Gather perspectives from all involved parties.
- Organize findings into concise categories. Articulate key takeaways, emphasizing actionable insights. Craft a narrative that not only acknowledges challenges but transforms them into opportunities.
- Integrate lessons into future plans. Align new initiatives with these insights to ensure history informs future action. Encourage a culture that embraces learning and growth.
- Regular Reassessment: Periodically revisit the template. As landscapes evolve, so does wisdom. Continuously refine the template to remain relevant and potent.
Additional Resources
- How to Use Lessons Learned Effectively to Avoid Project Failure
- Key Project Documents Every Project Manager Needs
- Lessons Learned Template
Research & Analysis
Cause and Effect Diagram

What is a Cause and Effect Diagram
A cause and effect diagram, also known as a fishbone diagram or Ishikawa diagram, is a visual tool used to analyze and identify the potential causes of a specific problem or effect. The diagram takes its name from its shape, which resembles the skeleton of a fish. It is a structured way to brainstorm and organize the various factors that could contribute to an issue, making it easier to understand the root causes.
When to Use
- Investigating complex problems.
- Engaging team collaboration.
- Analyzing process inefficiencies.
- Solving quality-related issues.
- Visualizing cause-effect relationships.
How to Use the Cause and Effect Diagram?
- Define the problem: Clearly identify the problem or effect you want to analyze. Write it down at the head of the diagram.
- Identify categories: Determine the main categories of factors that could contribute to the problem.
- Brainstorm potential causes: Brainstorm possible factors and sub-causes that might be causing the problem. Write these factors as smaller lines branching off from the respective categories.
- Analyze and evaluate: Discuss each potential cause and its relevance to the problem.
- Identify root causes: Look for causes that have a significant impact and are likely to be central to the problem. These are your potential root causes.
- Prioritize and verify: Prioritize the most likely root causes and verify them through data analysis, observations, or further investigation.
Additional Resources
- Fishbone Diagram Maker
- Fishbone Diagram Templates
- The Ultimate Guide to Fishbone Diagrams
- How to Use Cause and Effect Analysis
Competitor Analysis

What is a Competitive Analysis?
A competitive analysis, also known as a competitor analysis, is a strategic assessment process used by businesses to evaluate and understand the strengths and weaknesses of their competitors within the same industry or market segment. It involves gathering information about the products, services, marketing strategies, financial performance, and overall positioning of rival companies.
When to Use
- Understanding market dynamics.
- Developing competitive strategies.
- Benchmarking against rivals.
- Making informed business decisions.
- Planning for market differentiation.
How to Do a Competitive Analysis?
- Identify competitors: List direct and indirect competitors operating in the same market or industry.
- Gather information: Collect data on competitors' products, services, pricing, distribution, marketing, and customer feedback.
- Analyze SWOT: Evaluate each competitor’s strengths, weaknesses, opportunities, and threats to identify areas of advantage and vulnerability.
- Compare offerings: Compare your offerings to competitors', highlighting differences and potential unique selling points.
- Market positioning: Determine where competitors stand in terms of market share, reputation, and customer perception.
- Strategic insights: Based on the analysis, develop strategies to capitalize on competitors' weaknesses, differentiate your offerings, and position your business effectively.
Additional Resources
Customer Journey Map

What is a Customer Journey Map?
A customer journey map is a visual tool that businesses use to understand the complete experience a customer goes through when dealing with them. It shows the various steps, interactions, and emotions the customer encounters from first learning about the business to becoming a loyal customer.
When to Use
- Visualizing touchpoints and interactions.
- Identifying pain points and gaps.
- Improving customer satisfaction.
- Designing better user experiences.
- Enhancing product/service delivery.
How to Create a Customer Journey Map?
- Define customer persona: Start by understanding your typical customer. Define a detailed customer persona, including demographics, preferences, goals, etc.
- Identify customer touch points: List all the interactions or touchpoints a customer has with your business.
- Map stages: Divide the customer’s journey into key stages, such as Awareness, Consideration, Purchase, Use, and Advocacy.
- Plot emotions and actions: For each stage and touchpoint, map out the customer’s emotional state, actions, goals, and pain points.
- Analyze and improve: Identify areas where the customer experience can be improved. Develop solutions to improve the overall journey.
-
Additional Resources
- Customer Journey Map Templates
- Learn How to Create Customer Journey Maps
- Customer Journey Map Tool
Empathy Map

What is an Empathy Map?
An empathy map is a visual tool that helps teams gain a better understanding of their users. It is divided into four quadrants: Says, Does, Thinks, and Feels. The Says quadrant captures what the user says. The Does quadrant captures what the user does, both physically and digitally. The Thinks quadrant captures what the user is thinking. The Feels quadrant captures how the user is feeling, both emotionally and physically.
When to Use
- Understanding user or customer perspectives.
- Developing user-centered products or services.
- Identifying pain points and needs.
- Creating targeted marketing strategies.
How to Use the Empathy Map Template?
- Assemble a diverse team to bring different perspectives to the table.
- Select a specific persona or target group to empathize with.
- Engage in thoughtful discussions and research to populate each quadrant.
- Identify patterns and revelations to illuminate new avenues for innovation.
Additional Resources
- How to Visualize A Customer-Centric Strategy
- The Ultimate List Of Visual User Research Methods
- Empathy Map Template.
Force Field Analysis

What is a Force Field Analysis?
A force field analysis is a decision-making and problem-solving technique used to assess the driving and restraining forces that influence a proposed change or decision within an organization or situation. It was developed by Kurt Lewin, a social psychologist.
When to Use
- Assessing change or decision impact.
- Planning change management strategies.
- Gaining insights into resistance and support.
- Facilitating informed decision-making.
How to Do a Force Field Analysis?
- Define the change: Clearly define the change or decision you’re analyzing, and articulate its goals and expected outcomes.
- Identify driving forces: List all factors that encourage or support the change. These could be market trends, customer demands, competitive pressures, etc.
- Identify restraining forces: List factors that oppose the change, such as resistance from employees, financial constraints, cultural barriers, etc.
- Assign weight and score: Give a numerical value or score to each force to represent its strength or influence, typically on a scale of 1 to 5
- Visualize the forces: Create a visual representation with arrows indicating the direction and strength of each force. Driving forces push for change, while restraining forces counteract it.
- Analyze and decide: Assess the balance between driving and restraining forces. Develop strategies to enhance driving forces, address restraining forces, or find ways to minimize their impact to ensure successful change implementation.
Additional Resources
- Force Field Analysis Templates
- Guide to Understanding the Force Field Analysis
- Change Management Tools to Drive Change
User Persona Diagram

What is a User Persona Diagram?
A user persona diagram is a fictional representation of a specific type of user or customer that a product or service is designed for. User personas encompass various characteristics, behaviors, goals, needs, and preferences of a typical user within a specific demographic or user group.
When to Use
- Understanding user behaviors.
- Identifying user needs and goals.
- Designing user-centered products/services.
- Guiding product development decisions.
- Personalizing marketing strategies.
- Improving user experience.
How to Create a User Persona?
- Gather data: Collect insights from user research, surveys, interviews, and analytics to understand user behaviors, preferences, needs, and goals.
- Identify patterns: Analyze the collected data to identify common trends, behaviors, and pain points among users, and group them based on shared characteristics.
- Segmentation: Create distinct user segments, each representing a specific group with similar demographics, behaviors, and objectives.
- Create the user persona: Develop personas for each user segment by giving them a name, photo, and detailed attributes, including job role, age, goals, challenges, etc.
Additional Resources
- User Persona Creator
- How to Create a Buyer Persona
- UX Research Methods
- Visual User Research Methods
- UX Research Plan
Strategy & Planning
ADL Matrix

What is ADL Matrix?
The ADL matrix is a tool that can be used to understand the life cycle of an industry (from growth to decline) and then compare it with the market position, which helps businesses manage their portfolio.. The ADL matrix helps businesses to make critical decisions,by providing insights on where to invest, what strategies to employ and how to stay ahead of the competition.
When to Use
- Analyzing business portfolio.
- Evaluating strategic business units (SBUs).
- Assessing market growth and relative market share.
- Making resource allocation decisions.
- Developing growth strategies.
How to Use This Template?
- Compile data on market trends and competitive forces to rate Industry Attractiveness and Competitive Advantage on a scale.
- Plot your business units, products, or services on the matrix based on their scores in the two dimensions.
- Identify growth opportunities by pinpointing segments where Industry Attractiveness surpasses Competitive Advantage, prompting innovation or partnerships.
- Make informed resource allocation decisions by focusing efforts where your Competitive Advantage aligns with Industry Attractiveness.
Additional Resources
AIDA Model

What is the AIDA Model?
The AIDA (Attention, Interest, Desire and Action) model explains the four phases that a consumer goes through, before making a purchase decision. This framework helps content marketers better understand their target audience and create persuasive content that helps grab attention to their products, sparks interest, create a desire to attain them and ultimately drive action to purchase.
When to Use
- Creating marketing or advertising content.
- Guiding customer engagement.
- Designing persuasive communication.
- Building awareness of a product or service.
How to Use the AIDA Model?
- Grab your audience’s focus with a powerful hook. Pose a question, share a startling statistic, or craft a compelling headline that stops them in their tracks.
- Once you have their attention, unveil a problem they can relate to, and then offer a solution that captivates their interest. Showcase benefits and unique selling points to keep them engaged.
- Present the value of your product or idea. Appeal to emotions, show how it fulfills their needs, and paint a vivid picture of the positive outcomes it brings.
- Seal the deal with a clear and compelling call to action. Whether it’s to buy, sign up, or simply learn more, guide your audience towards the next steps they need to take.
Additional Resources
Ansoff Matrix

What is an Ansoff Matrix?
The Ansoff matrix, also known as the Ansoff Growth Matrix, is a strategic framework used to analyze and plan business growth strategies. The Ansoff matrix presents four growth strategies: Market Penetration (increasing sales in current markets), Market Development (entering new markets with existing products), Product Development (introducing new products to current markets), and Diversification (launching new products in new markets).
When to Use
- Expanding product lines or offerings.
- Identifying strategic directions.
- Assessing risk and potential rewards.
- Making informed expansion decisions.
How to Use the Ansoff Matrix?
- Define your objective: Clearly state your growth goal, such as increasing market share, expanding into new markets, launching new products, or diversifying your business.
- Assess your current position: Understand your current products, target markets, and competitive landscape. Identify where you are on the matrix (existing products/markets or new products/markets).
- Choose the relevant strategy: Select the growth strategy that aligns with your objective and current position.
- Develop an action plan: Create a detailed plan for implementing the chosen strategy. Specify the tactics, resources, and timeline required to execute the plan effectively.
- Monitor and adjust: Continuously track the progress of your chosen strategy, analyzing the results against your objective.
Additional Resources
BCG Matrix

What is the BCG Matrix?
Devised by Boston Consulting Group, this matrix helps categorize your products or services and make informed decisions about resource allocation. The categorization is done based on four quadrants.
- Cash cows: Products with a high market share in a low-growth market. They generate a lot of cash, but they don’t require a lot of investment.
- Dogs: Products with a low market share in a low-growth market. They are not profitable and may be candidates for divestment.
- Stars: Products with a high market share in a high-growth market. They require a lot of investment, but have the potential to be very profitable.
- Question marks: Products with a low market share in a high-growth market. They are not yet profitable, but they have the potential to become stars if they receive enough investment.
When to Use
- Analyzing a business’s product portfolio.
- Evaluating market growth and market share.
- Identifying strategic priorities for different products.
- Developing growth and divestment strategies.
- Planning for future product development.
How to Use the BCG Matrix?
- Gather data on market growth rate and relative market share for each product.
- Position products on the matrix based on their growth and share values.
- Identify Stars for growth investment, Cash Cows for steady income generation, Question Marks for potential, and Dogs for reassessment.
- Devise strategies tailored to each quadrant. Nurture Stars, optimize Cash Cows, decide on Question Marks' fate, and consider divestment or revitalization for Dogs.
Additional Resources
Business Capability Map

What is a Business Capability Map?
A business capability map provides a snapshot of a business’s inner workings. It captures the fundamental abilities, processes, technologies, and resources that facilitate your operations. This framework serves as a strategic tool, enabling leaders, managers, and stakeholders to align their vision, make informed decisions, and drive growth.
When to Use
- Analyzing an organization’s core capabilities.
- Identifying strengths and weaknesses within operations.
- Planning for growth or transformation.
- Improving resource allocation decisions.
- Communicating complex business structures clearly.
How to Use the Business Capability Map?
- Identify and document key capabilities across departments. What sets you apart? What’s your secret sauce?
- Visualize the relationships between capabilities, revealing insights that fuel innovation and synergies.
- Map current and future states. Chart your growth path, highlighting gaps and opportunities for investment and improvement.
- With a clear map, empower your teams to deliver results, aligning efforts with overarching objectives.
Additional Resources
Business Model Canvas

What is a Business Model Canvas?
The Business Model Canvas is a strategic tool that provides a structured framework for developing, describing, and analyzing a business model. The canvas consists of nine key blocks that cover the essential aspects of a business: customer segments, value propositions, channels, customer relationships, revenue streams, key resources, key activities, key partnerships, and cost structure.
When to Use
- Communicating business concepts succinctly.
- Developing or refining a business idea.
- Designing a new business model.
How to Use the Business Model Canvas?
- Start with a clear focus: Begin by identifying a specific business or project for which you want to design or analyze the business model. Define the purpose, objectives, and scope of the canvas.
- Fill in each block: Work through each of the nine blocks of the canvas, filling in the details related to your business or project.
- Visualize the interactions: Focus on how each block interacts with the others.
- Identify gaps and opportunities: Evaluate your canvas to identify areas of strength, weaknesses, gaps, or opportunities. Look for potential innovations, cost-saving measures, and ways to improve value delivery to customers.
- Communicate and collaborate: Use the canvas as a visual communication tool within your team, with stakeholders, or when seeking investments or partnerships.
Additional Resources
Impact Effort Matrix

What is an Impact Effort Matrix?
The Impact Effort Matrix helps you to discover high-impact opportunities by evaluating tasks or ideas based on their potential impact and required effort. It helps guide your business decisions with clarity and precision. Whether you’re a leader, project manager, or an individual aiming to maximize efficiency, this template empowers you to prioritize wisely. Use the impact effort matrix to channel resources efficiently, and align efforts towards achieving organizational goals.
When to Use
- Assessing potential initiatives based on impact and effort.
- Making decisions on resource allocation.
- Identifying quick wins and high-impact opportunities.
- Focusing on projects that deliver the most value.
How to Use the Impact Effort Matrix?
- List your projects on the horizontal axis, from game-changing innovations to routine tasks.
- Vertically, gauge the potential impact of each project – high, medium, or low.
- Assign an effort level to each project – simple, moderate, or complex.
- Plot your projects on the matrix. Instantly, you’ll see the high-impact, low-effort gems, and the complex tasks that might demand more resources.
Additional Resources
Lean Canvas

What is the Lean Canvas Template?
The Lean Canvas template is a business planning tool that helps entrepreneurs visualize and test business ideas. It is divided into nine sections, including problem, solution, key metrics, and cost structure. The Lean Canvas template can be used to validate assumptions, identify risks, and iterate on your business model. Here are the nine sections of the Lean Canvas template:
- Problem: What problem are you solving?
- Solution: How are you solving the problem?
- Customer Segments: Who are your target customers?
- Channels: How will you reach your customers?
- Customer Relationships: How will you interact with your customers?
- Revenue Streams: How will you make money?
- Key Activities: What are the most important things you need to do to run your business?
- Key Resources: What resources do you need to succeed?
- Key Partnerships: Who can help you achieve your goals?
When to Use
- Developing a new business idea.
- Evaluating a business model quickly.
- Testing assumptions and hypotheses.
- Focusing on problem-solving and solutions.
- Iterating and adapting the business concept.
How to Use the Lean Canvas Template?
- Start by clearly defining the problem you’re addressing. What pain point are you solving?
- Articulate your solution succinctly. How does your product/service resolve the identified problem?
- Identify your ideal customers. Who will benefit most from your solution?
- Outline how your business generates income. What pricing model works best for your solution?
Additional Resources
OKR Goal Setting Template

What is an OKR Goal Setting Template?
The OKR goal setting template is a framework for setting and tracking goals. It stands for Objectives and Key Results. Objectives are ambitious but achievable. They should be specific, measurable, attainable, relevant, and time-bound. Key Results are measurable steps that will help you achieve your objectives. They should be specific, quantifiable, and trackable.
OKRs are set quarterly. This allows teams to regularly review and adjust their goals.
OKRs are transparent. Everyone in the organization should know what the goals are and how they are being measured.
When to Use
- Setting and tracking goals.
- Measure the success of new projects and initiatives.
- Performance measurement.
How to Use it?
- Outline specific and achievable objectives.
- Set measurable key results that reflect tangible milestones towards your objectives.
- Assign responsibilities for each key result, ensuring a clear chain of accountability.
- Consistently track your progress and adapt your OKRs as needed.
Additional Resources
Operating Model Canvas

What is an Operating Model Canvas?
The Operating Model Canvas - developed by Andrew Campbell, Mikel Gutierrez, and Mark Lancelott - is a visualization of how your business delivers value to customers. It is also a representation of how an organization operates. The operating model canvas template includes the following components:
- Processes – the work that should be done to deliver the value proposition
- Organization – how the people who are responsible to do the work is organized
- Locations – where the work is done (what buildings and assets are needed in these locations)
- Information – what information is needed to get the work done
- Suppliers – who provides inputs to the work and stakeholder relationships
- Management systems – Processes that are used to manage business operations such as planning, budgeting, etc.
When to Use
- Designing or refining an organization’s operating model.
- Identifying areas for improvement and innovation.
- Aligning business operations with strategic goals.
- Communicating the organization’s structure and operations.
How to Use the Operating Model Canvas?
- Assemble your team. Collaborate to discover insights and perspectives on each of the above components.
- Brainstorm with your team members and gather their feedback to refine your understanding.
- Pivot, iterate, and uncover opportunities. The Canvas allows you to test, learn, and evolve, ensuring your business stands strong in any market.
- Revisit the Canvas as you grow, adapting to shifting market trends.
Additional Resources
Perceptual Map

What is a Perceptual Map?
A perceptual map template is a tool that marketers use to understand how consumers perceive their products or brands relative to the competition. The template typically plots two or more key attributes of the products or brands on a two-dimensional axis, such as price and quality. The relative positions of the products or brands on the map indicate how consumers perceive them based on those attributes. Perceptual maps can be used to identify opportunities for product differentiation, to target marketing campaigns, and to track changes in consumer perceptions over time.
When to Use
- Analyzing market positioning.
- Visualizing consumer perceptions.
- Identifying competitive gaps.
- Assessing brand attributes.
- Understanding market trends.
How to Use the Perceptual Map?
- Pinpoint the crucial attributes that define your market, such as price, quality, or features.
- Place competing products on the map relative to these attributes.
- Plot your product, pinpointing its current market position.
- Analyze the map to devise effective strategies for repositioning, differentiating, or targeting specific customer segments.
Additional Resources
- Implement a Successful Marketing Intelligence Strategy
- Guide to Building an Effective Go-to-Market Strategy
PEST Analysis

What is a PEST Analysis
A PEST analysis is a strategic framework used by businesses to assess the external macro-environmental factors that can impact their operations: Political, Economic, Social, and Technological.
When to Use
- Analyzing macro-environmental influences.
- Evaluating business strategy impact.
- Considering market and industry trends.
- Making informed strategic decisions.
- Planning for market entry or expansion.
How to Conduct a PEST Analysis?
- Identify categories: Divide the analysis into four categories: Political, Economic, Social, and Technological.
- Political factors: Examine political influences such as regulations, government stability, trade policies, and legal considerations that could impact the business.
- Economic factors: Evaluate economic indicators like GDP growth, inflation rates, exchange rates, and market trends that affect the business’s financial stability and growth potential.
- Social factors: Explore societal trends, demographics, cultural shifts, consumer behavior, and attitudes that could influence demand, preferences, and marketing strategies.
- Technological factors: Consider technological advancements, innovation, automation, and disruptions that may impact operations, products, or services.
- Assessment and action: Analyze the collected data in each category to identify opportunities and threats. Develop strategies to capitalize on favorable factors and mitigate risks posed by unfavorable factors, aligning the business with the changing external environment.
Additional Resources
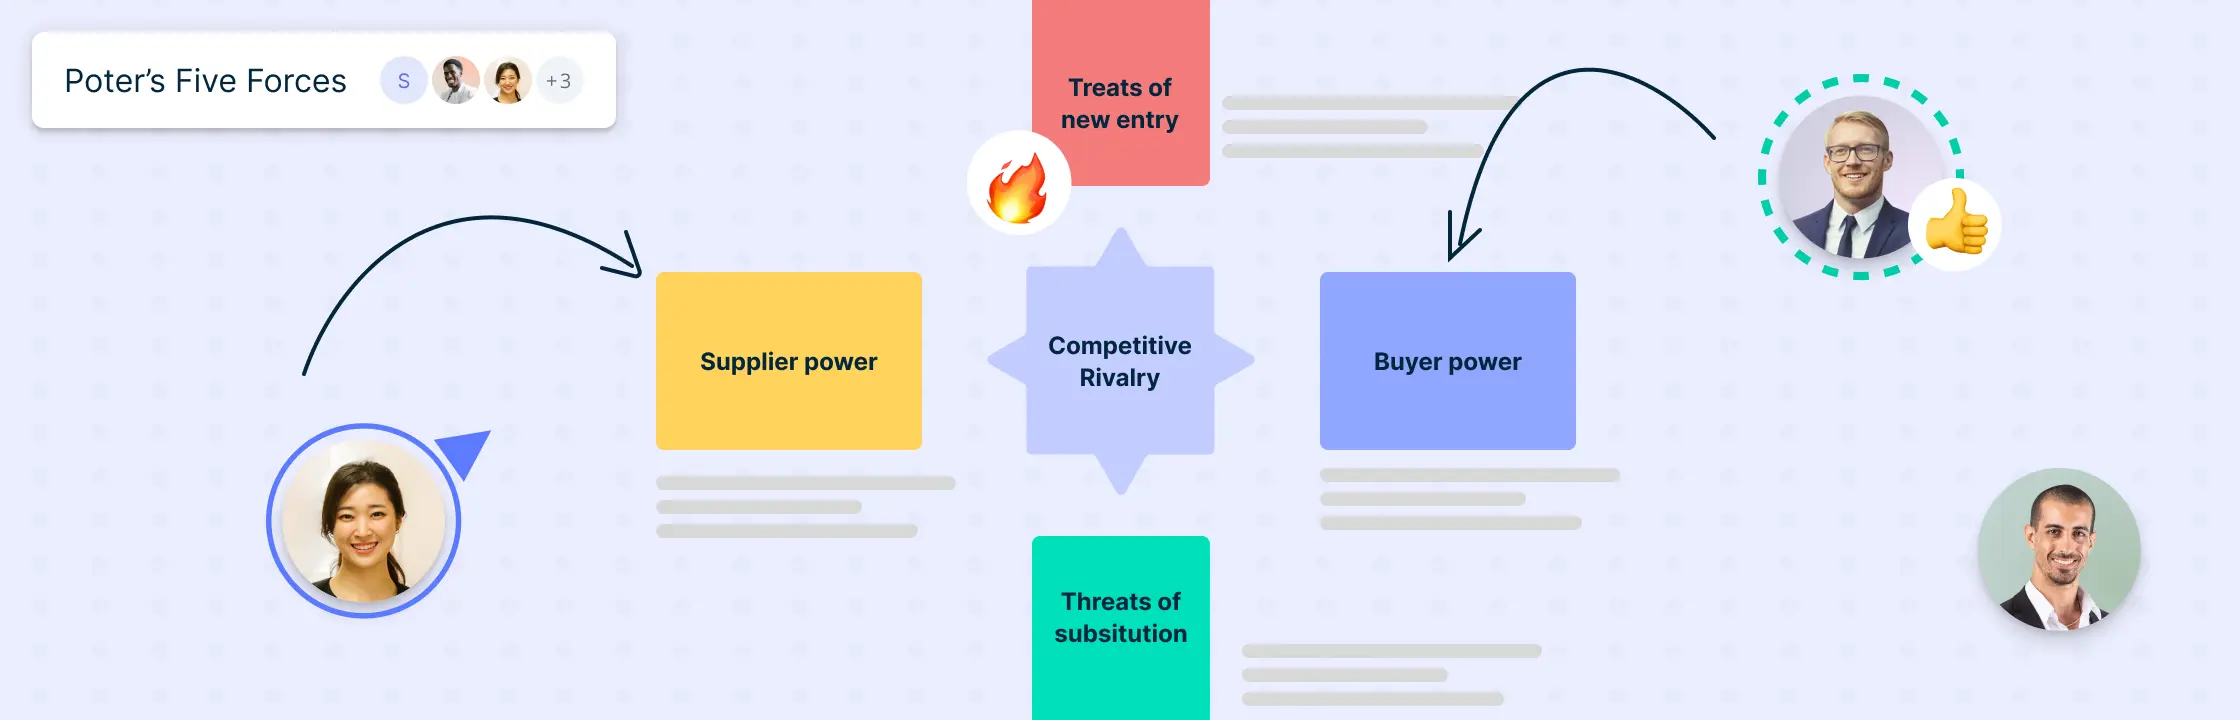
Porter’s Five Forces

What is Porter’s Five Forces Analysis?
Porter’s five forces analysis template is a strategic management tool that helps businesses assess the competitive landscape of an industry. The five forces are:
- The threat of new entrants: How easy is it for new businesses to enter the market?
- Bargaining power of suppliers: How much power do suppliers have over prices?
- Bargaining power of buyers: How much power do buyers have over prices?
- The threat of substitute products or services: How easy is it for customers to switch to alternative products or services?
- Rivalry among existing competitors: How intense is the competition between existing businesses in the industry?
By understanding these forces, businesses can develop strategies to improve their competitive position and profitability.
When to Use
- Entering new markets.
- Product launches.
- Introducing new pricing strategies.
- Entering into strategic partnerships.
- Market expansion.
How to Use It?
- Collect data on market opportunities, competitor profiles, and industry trends.
- Evaluate the five forces, grading their impact on your business. Pinpoint vulnerabilities and opportunities.
- Devise a proactive plan. Evaluate your strengths, mitigate threats, and enhance your competitive advantage.
- Regularly reassess your analysis to adapt to shifting forces and maintain your edge.
Additional Resources
- The Easy Guide to Performing an Effective Situation Analysis
- How to Do a Competitive Analysis
- How to Successfully Achieve and Sustain Competitive Advantage
Product Roadmap

What is a Product Roadmap?
A product roadmap is a strategic planning tool used by businesses to outline the vision, goals, and timeline for the development and enhancement of a product. It provides a high-level overview of the product’s evolution, including key features, milestones, and planned releases. The product roadmap helps align teams, stakeholders, and resources around a shared product vision, making sure that everyone is on the same page regarding the product’s direction.
When to Use
- Planning product development.
- Communicating product strategy.
- Managing product features.
- Prioritizing tasks and releases.
- Tracking product progress.
How to Create a Product Roadmap?
- Define vision: Clearly articulate the product’s overall vision, goals, and objectives.
- Identify priorities: Determine the most important features, enhancements, or fixes based on customer needs, market trends, and business goals.
- Set timeline: Outline key milestones and expected release dates for each prioritized item, creating a timeline for the product’s development.
- Share with teams: Communicate the roadmap to relevant teams, such as product, development, sales, and marketing, ensuring alignment and understanding.
- Review and adapt: Regularly review the roadmap, assess progress, and adjust priorities based on customer feedback, & changing technology or business requirements.
Additional Resources
- How to Create a Product Roadmap
- Product Roadmapping Software
- Online Roadmap Maker
- Business Roadmap Template
Project Charter

What is a Project Charter?
The Project Charter Template is a strategic blueprint that defines the project’s scope, objectives, stakeholders, and initial roadmap. It lays the groundwork for seamless collaboration, clear communication, and informed decision-making from the project’s inception. Project Charter helps teams to align efforts toward shared goals.
When to Use
- Initiating a new project.
- Establishing project constraints and assumptions.
- Setting project goals and success criteria.
- Gaining approval and commitment from stakeholders.
- Providing a clear project foundation for teams.
How to Use the Project Charter
- Clearly establish the project’s purpose, goals, and expected outcomes.
- Pinpoint the stakeholders, team members, and sponsors. Knowing who’s involved ensures smooth communication and accountability.
- Clearly define the project’s boundaries, deliverables, and constraints. This prevents scope creep and keeps the project on track.
- Present the Charter to stakeholders for buy-in. Their approval solidifies commitment and lays the groundwork for a successful project.
Additional Resources
Risk Assessment Matrix

What is the Risk Assessment Matrix?
The Risk Assessment Matrix is a useful visual tool to foresee and manage potential risks. Streamline decision-making as you identify, evaluate, and prioritize risks that might hinder your goals. This framework allows project managers, entrepreneurs, and safety officers to take proactive action to mitigate vulnerabilities. It brings together quantitative analysis with qualitative insights, revealing vulnerabilities and helping to devise strategies to mitigate them.
When to Use
- Developing risk mitigation strategies.
- Communicating risk information to stakeholders.
- Making informed decisions about risk management.
- Identifying areas needing increased attention.
How to Use the Risk Assessment Matrix?
- List down potential risks by brainstorming various scenarios that your venture might encounter. These could range from market fluctuations to operational mishaps.
- Quantify the potential impact and likelihood of each scenario. A sophisticated scoring system aids in prioritizing where attention is paramount.
- Craft actionable strategies to mitigate each identified risk. With clarity and foresight, you’ll be ready to steer clear of obstacles.
- Markets are dynamic, and risks evolve. Regularly revisit your template to align it with the shifting landscape, ensuring perpetual preparedness.
Additional Resources
SMART Goal Framework

What is a SMART Goal?
The SMART goal criteria is a structured framework used to create goals that are Specific, Measurable, Achievable, Relevant, and Time-bound. Each component of the SMART acronym helps make sure that the goal is well-defined and has a higher likelihood of being successfully achieved.
When to Use
- Setting clear objectives.
- Enhancing goal clarity.
- Monitoring progress effectively.
- Focusing on specific outcomes.
- Creating actionable plans.
How to Set a SMART Goal?
- Identify your goal: Start by clearly defining what you want to achieve. Be specific about the outcome you’re aiming for.
- Make it specific: Clearly state the goal’s focus. Ask yourself who, what, where, when, and why to make sure the goal is detailed and clear.
- Quantify measurable metrics: Determine how you’ll measure progress and success. Use numbers or percentages to track your goal’s achievement.
- Assess achievability: Consider whether the goal is realistic and attainable within your resources and capabilities. Avoid setting goals that are too easy or too challenging.
- Ensure relevance: Check if the goal aligns with your overall objectives and priorities. Make sure that achieving the goal contributes meaningfully to your larger plans.
- Set a Timeline: Define a specific timeframe or deadline by which you aim to accomplish the goal. This creates a sense of urgency and focus.
- Write down the SMART Goal: Craft a concise statement that incorporates all the SMART elements. Make sure it’s clear, measurable, achievable, relevant, and time-bound.
- Plan your approach: Outline the steps or actions you’ll take to reach the goal. Break down the process into manageable tasks.
Additional Resources
- SMART Goals Template
- The SMART Guide to Streamlining Your Projects
- The Easy Guide to the Goal Setting Process
SOAR Analysis

What is a SOAR Analysis?
SOAR, an acronym for Strengths, Opportunities, Aspirations, and Results, serves as a tool for organizations and individuals to identify their capabilities and align those with goals and objectives. This framework explores the strengths of an organization. It also helps discover emerging opportunities. SOAR addresses aspirations and desired outcomes. This emphasis on results helps organizations to take rightful actions that align with their overall goals.
Business leaders leverage SOAR to refine corporate strategies, educators incorporate it to guide academic institutions, and individuals adopt it to shape personal trajectories.
When to Use
- Identifying areas for growth and improvement.
- Building on existing assets and resources.
- Encouraging innovation and creativity.
- Developing future-oriented strategies.
- Promoting positive organizational change.
How to Use SOAR Analysis?
- Begin by identifying your organization’s core strengths, encompassing talents, expertise, and unique resources. Unveil what sets you apart in the market.
- Explore external opportunities within your industry, market trends, and evolving customer needs. Uncover potential avenues for growth and innovation.
- Envision your desired future. Craft ambitious yet achievable goals that resonate with your organization’s mission and values. Create a roadmap for progress.
- Develop actionable strategies based on strengths and opportunities. Execute your plans diligently, tracking measurable results. Adapt as needed to ensure consistent advancement.
Additional Resources
Stakeholder Map

What is a Stakeholder Map?
A stakeholder map, also known as a stakeholder analysis or stakeholder matrix, is a visual tool used by businesses and organizations to identify and categorize individuals, groups, or entities that have an interest or stake in a particular project, decision, or initiative. The map helps to identify stakeholders, depict the relationships between them and the level of influence they hold over the outcome.
When to Use
- Visualizing stakeholder relationships.
- Analyzing their influence and interest.
- Prioritizing engagement efforts.
- Planning communication strategies.
- Managing stakeholder expectations.
How to Create a Stakeholder Map?
- Identify stakeholders: List all individuals, groups, or organizations that have an interest or influence in your project or decision.
- Determine interest and influence: For each stakeholder, assess their level of interest in the project and their degree of influence over its outcome.
- Categorize stakeholders: Plot each stakeholder on a grid with interest on one axis and influence on the other. This categorizes them into quadrants: High Interest/High Influence, High Interest/Low Influence, Low Interest/High Influence, and Low Interest/Low Influence.
- Analyze priorities: Focus your attention on stakeholders in the High Interest/High Influence quadrant. Tailor your communication and engagement strategies based on the priorities of each quadrant.
- Document details: Add relevant information for each stakeholder, including their roles, expectations, concerns, and preferred communication methods.
Additional Resources
- Stakeholder Analysis Example
- Stakeholder Register Template
- Guide to Stakeholder Management
- Stakeholder Management Plan Templates
- Stakeholder Engagement Plan
STEEPLE Analysis

What is STEEPLE Analysis?
The STEEPLE Analysis template helps organizations make decisions by evaluating the external forces shaping their environment. STEEPLE is an acronym for Social, Technological, Economic, Environmental, Political, Legal, and Ethical factors. Social aspects delve into cultural trends and societal shifts, while the Technological dimension explores innovations driving change. Economic factors focus on financial impacts, while Environmental and Ethical factors gauge sustainability and morality. Political and Legal components consider governmental influences and regulatory changes.
When to Use
- Assessing potential impacts on business.
- Understanding industry trends and changes.
- Planning strategic responses to external influences.
- Enhancing strategic planning and risk management.
How to Use the STEEPLE Analysis?
- Collect data on each dimension—social trends, technological advancements, economic indicators, environmental concerns, political landscape, legal regulations, and ethical considerations.
- Evaluate the collected data to identify trends, opportunities, and challenges within each dimension.
- Discover intersections and correlations between dimensions. How might political decisions influence technology, for instance?
- Craft strategies that align with the insights gained, fortifying your business against uncertainties and fostering innovation.
Additional Resources
Strategy Map

What is a Strategy Map?
A strategy map is a visual framework that provides a clear and concise representation of an organization’s strategic goals, objectives, and the cause-and-effect relationships between them. It is designed to depict how various components of a business’s strategy are interconnected and how they contribute to achieving the organization’s mission and vision.
When to use
- Visualizing strategic objectives.
- Communicating strategy clearly.
- Depicting cause-and-effect relationships.
- Monitoring progress towards goals.
How to Create a Strategy Map?
- Define objectives: Identify the key strategic objectives that support the organization’s mission and vision.
- Categorize perspectives: Group objectives into perspectives such as Financial, Customer, Internal Processes, and Learning & Growth.
- Establish relationships: Determine how objectives in one perspective contribute to objectives in other perspectives.
- Arrange hierarchically: Organize objectives within each perspective hierarchically, from high-level goals to more specific objectives.
- Visual representation: Create a visual diagram using shapes or boxes connected by arrows to depict the relationships between objectives.
- Review and refine: Make sure the map is coherent, aligned with the organization’s strategy, and visually clear. Refine as needed to accurately convey the strategic connections.
Additional Resources
Strategy Diamond

What is Strategy Diamond?
The Strategy Diamond Template is a tool used by businesses and organizations to crystalize their strategic thinking, align their goals, and drive effective decision-making. This framework, often attributed to management guru Donald Hambrick and James Fredrickson, offers a comprehensive view of a company’s strategy by breaking it down into five key elements: Arenas, Vehicles, Differentiators, Staging, and Economic Logic.
When to Use
- Developing new strategies.
- Reviewing or refining an existing strategy.
- Creating communication strategies.
- Responding to changing market conditions.
How to use it?
- Arenas: Start by identifying the broad market spaces or arenas where your organization competes. This could involve geographical locations, product lines, customer segments, or distribution channels. Define the boundaries of your strategic scope.
- Vehicles: Determine the key strategic vehicles your organization will use to compete in the chosen arenas. These could be specific products, services, or technologies. Assess their potential for success and alignment with your overall strategy.
- Differentiators: Pinpoint the unique attributes and differentiators that set your offerings apart from competitors. This step is crucial for creating a compelling value proposition and building a sustainable competitive advantage.
- Staging and Economic Logic: Outline the sequence of actions (staging) required to achieve your strategic objectives. Additionally, clarify the underlying economic logic of your strategy, addressing how your chosen vehicles and differentiators will create value for your organization.
Additional Resources
- Strategy Diamond
- The Top 7 Tried and Tested Strategy Frameworks for Businesses
- How to Visualize an Organizational Strategy
SWOT Analysis

What is a SWOT Analysis?
A SWOT analysis is a strategic planning tool used by individuals, teams, or businesses to assess their current situation.SWOT stands for Strengths, Weaknesses, Opportunities, and Threats. SWOT analysis guides businesses in crafting effective strategies, making informed decisions, and adapting to changing environments, ultimately driving success and growth.
When to Use
- Assessing business strategies.
- Evaluating a project’s viability.
- Understanding market positioning.
- Developing action plans.
- Considering new ventures or changes.
How to Conduct a SWOT Analysis?
- Gather information: Collect data and insights about your business, project, or situation (i.e. internal assessments, market research, & competitor analysis).
- Identify strengths and weaknesses: List your internal strengths and weaknesses. These are aspects you have control over and can work on to improve your position.
- Identify opportunities and threats: List external opportunities and threats that could impact your objectives. These are factors you can’t control, but you can prepare for or leverage.
- Combine insights: Examine the relationships between your internal factors and external factors. For example, how can you use your strengths to seize opportunities, or how can you address weaknesses to mitigate threats?
- Develop strategies: Based on your analysis, develop strategies that use your strengths to seize opportunities, address weaknesses to minimize threats, and so on.
- Prioritize and take action: Rank the factors within each category in terms of their importance and impact. Focus on the most critical ones when developing your strategies.
Additional Resources
- SWOT Analysis Tool
- SWOT Analysis Templates for Any Situation
- How to do a SWOT analysis
- Personal SWOT Analysis
Value Chain Analysis

What is Value Chain Analysis?
A value chain analysis template is a tool that businesses can use to identify and improve the activities that create value for their customers. It is a visual representation of the company’s operations, broken down into primary activities (inbound logistics, operations, outbound logistics, marketing and sales, and service) and support activities (procurement, technology development, human resource management, and firm infrastructure).
When to Use
- Analyzing a company’s internal activities.
- Identifying opportunities for cost reduction.
- Assessing areas for process improvement.
- Evaluating competitive advantage sources.
- Aligning activities with strategic goals.
How to Use Value Chain Analysis?
- Begin by visualizing your organization’s value activities – from inbound logistics to marketing and beyond. This clear bird’s-eye view lays the foundation.
- Pinpoint crucial activities contributing to costs and differentiation. What sets you apart? What can be streamlined?
- Assess each activity’s efficiency. Are there innovative technologies or processes that can boost productivity?
- Armed with insights, craft strategies that align with your findings. Enhance customer experiences, optimize costs, and cement your market position.
Additional Resources
- What is Value Stream Mapping?
- How to Successfully Achieve and Sustain Competitive Advantage
- The Top 7 Tried and Tested Strategy Frameworks for Businesses
Value Proposition Canvas

What is it?
The value proposition canvas helps organizations to align their products and services with what the customer values and needs. It is divided into two blocks as follows.
Customer Profile
- Gains – Needs and the benefits that a customer expects. What would delight the customer.
- Pains – Negative emotions that a customer experiences when getting something done.
- Customer jobs – The needs they are trying to satisfy and the problems they are trying to solve.
Value Map
- Gain creators – How the product adds value to customers and how it creates customer gains.
- Pain relievers – How does the product alleviate customer pains?
- Products and services – The products and services that add value to the customer while creating gains and alleviating pains.
When to Use
- Understanding customer needs and pain points.
- Refining products and services.
- Differentiating from competitors.
How to use it?
- Identify your target audience. Define their jobs, pains, and gains they seek.
- Map your products to customer needs. Highlight how you alleviate their pains and amplify their gains.
- Analyze what customers crave and how your offerings satisfy those cravings.
- Continuously enhance your value proposition by refining your canvas based on feedback and insights.
Additional Resources
VRIO Analysis

What is VRIO Analysis?
Entrepreneurs, managers and strategists use VRIO analysis to identify competitive advantages within businesses. It helps evaluate organizations’ resources based on four dimensions: Value, Rarity, Imitability, and Organization. This method reveals a company’s unique strengths, resources and areas for improvement.
VRIO Analysis transforms insights into actionable strategies. Whether you’re refining your product’s distinctiveness or amplifying your market presence, VRIO helps your business achieve strategic success.
When to Use?
- Assess and optimize resource allocation
- Evaluate competitive advantage
- Identifying competitive weaknesses
- Make market entry Decisions
- R&D and innovation
How to Use the VRIO Analysis?
- List your company’s key tangible and intangible resources.
- Determine to what extent they add value and if they’re rare in the market.
- Analyze how easy it is for competitors to replicate these resources.
- Create an operational structure that will help your organization to effectively leverage these resources.
Additional Resources
5 Whys Analysis

What is 5 Whys Analysis?
Five Whys Analysis is a structured method that helps to uncover the fundamental “whys” behind a problem. By iteratively asking “why” five times, it reveals underlying factors contributing to an issue, which are otherwise obscured on the surface. Whether you’re an engineer, manager, or a project leader, the 5 Whys Analysis empowers you to pinpoint the root causes of a problem.
When to Use?
- Investigating root causes of problems.
- Uncovering underlying issues or factors.
- Identifying systemic reasons for failures.
- Promoting deeper understanding of issues.
- Developing effective corrective actions.
How to Use the 5 Whys Analysis?
- Clearly define the problem you’re facing, ensuring everyone is on the same page.
- Probe the initial problem with “Why?” questions. Continuously dig deeper, unraveling the layers of causation. Repeat this step at least five times.
- Synthesize the “Whys” to pinpoint the root cause. This deep understanding paves the way for targeted solutions.
- Armed with a precise understanding, enact corrective measures. Monitor outcomes and refine as needed.
Additional Resources
- Problem-Solving Through Root-Cause Analysis
- Guide for Efficient Business Problem-Solving
- 13 Decision-Making Techniques and Tools for Business
Task Management
Eisenhower Matrix

What is the Eisenhower Matrix?
The Eisenhower matrix, also known as the urgent-important matrix, is a simple tool for prioritizing tasks and making effective decisions about how to spend your time. It helps you categorize tasks based on their urgency and importance, allowing you to focus on what matters most. It was popularized by Dwight D. Eisenhower, the 34th President of the United States.
When to Use
- Prioritizing urgent tasks.
- Allocating resources for important goals.
- Streamlining delegation & project planning.
- Aligning activities with strategic objectives.
How to Use the Eisenhower Matrix
- Create the Eisenhower matrix: Draw a grid with four quadrants or use a pre-made Creately template to get a head start.
- Urgent and Important (Quadrant 1): Tasks that are both urgent and important go here. These are top priorities and need immediate attention.
- Important but Not Urgent (Quadrant 2): Tasks that are important but not urgent. These tasks contribute to your long-term goals and should be scheduled to avoid becoming urgent later.
- Urgent but Not Important (Quadrant 3): Tasks that are urgent but not important are placed here. These tasks can often be delegated or minimized to free up more time for Quadrant 1 and 2 tasks.
- Neither Urgent nor Important (Quadrant 4): Tasks that are neither urgent nor important. These tasks are distractions and should be minimized or eliminated.
- Prioritize and act: Start with Quadrant 1 tasks, as they need immediate attention. Move on to Quadrant 2 tasks, as these impact your goals. Delegate or minimize Quadrant 3 tasks, and avoid Quadrant 4 tasks.
- Regular review: Review regularly and update your Eisenhower matrix. Tasks can shift between quadrants as circumstances change.
Creately Resource
Gantt Chart

What is a Gantt Chart?
A Gantt chart is a visual tool used in project management to plan, schedule, and track tasks and activities over a specific period of time. It shows a graphical representation of a project’s timeline, highlighting the start and end dates of various tasks or activities, their dependencies, and the overall progress of the project.
When to Use
- Visualizing task timelines.
- Tracking task dependencies.
- Monitoring progress.
- Allocating resources.
- Communicating project status.
How to Create a Gantt Chart?
- Identify tasks: List all the tasks and activities required for your project. Break down large tasks into smaller, manageable subtasks.
- Timeline setup: Create a timeline along the horizontal axis, representing the project’s start and end dates. Assign tasks to their respective timeframes by plotting horizontal bars.
- Identify task dependencies: Identify the tasks that must be completed before others can begin – and connect them on the chart. Make sure the sequence is clear to avoid bottlenecks.
- Bar length and milestones: Adjust the length of each task’s bar to reflect its duration. Add vertical lines to represent significant milestones or deadlines.
- Allocate resource: Assign responsible team members to each task. Make sure that team members are not overloaded and that dependencies are considered.
- Monitor and update: Update the Gantt chart regularly to reflect actual progress. As tasks are completed, adjust the bars accordingly, and note any delays.
Additional Resources
- Gantt Chart Maker
- Gantt Chart Templates to Create Project Timelines
- Draw Gantt Charts Online Easily Using Creately
- Gantt Charts and Flowcharts in Project Planning
Workflow Diagram

What is a Workflow Diagram?
A workflow diagram is a visual tool that illustrates the sequence of steps, tasks, activities, or processes required to complete a specific project, task, or operation. It provides a clear and concise overview of how work flows from one stage to another, highlighting the relationships and dependencies between different elements of the process.
When to Use
- Mapping task sequences.
- Clarifying work procedures.
- Identifying bottlenecks.
- Communicating workflows.
- Analyzing process efficiency.
How to Create a Workflow Diagram?
- Define process and goals: Clearly define the specific process you’re diagramming. Understand the objectives of the process and define itsarting and ending points.
- Gather information: Gather information about the sequence in which tasks occur, the inputs required for each task, the outputs produced, and any decision-making factors.
- Draw the diagram: Using the specific workflow diagram shapes, create the diagram to visualize the workflow.
- Show inputs, outputs, and relationships: Use arrows to show which inputs are needed for each task, entering the respective task shapes. If certain tasks are dependent on others or have specific relationships, show these connections with arrows.