A context diagram stands as a cornerstone in system analysis, offering a bird’s-eye view of a system’s landscape. It’s a high-level representation that encapsulates the system’s scope, illustrating how it interacts with external entities—users, systems, and data flows. Unlike other system representation tools that delve into granular details, the context diagram keeps it simple; it’s the 30,000-foot overview that provides clarity without overwhelming stakeholders with complexity. This guide will take you through everything you need to know about a context diagram and how you can create one.
What is a context diagram?
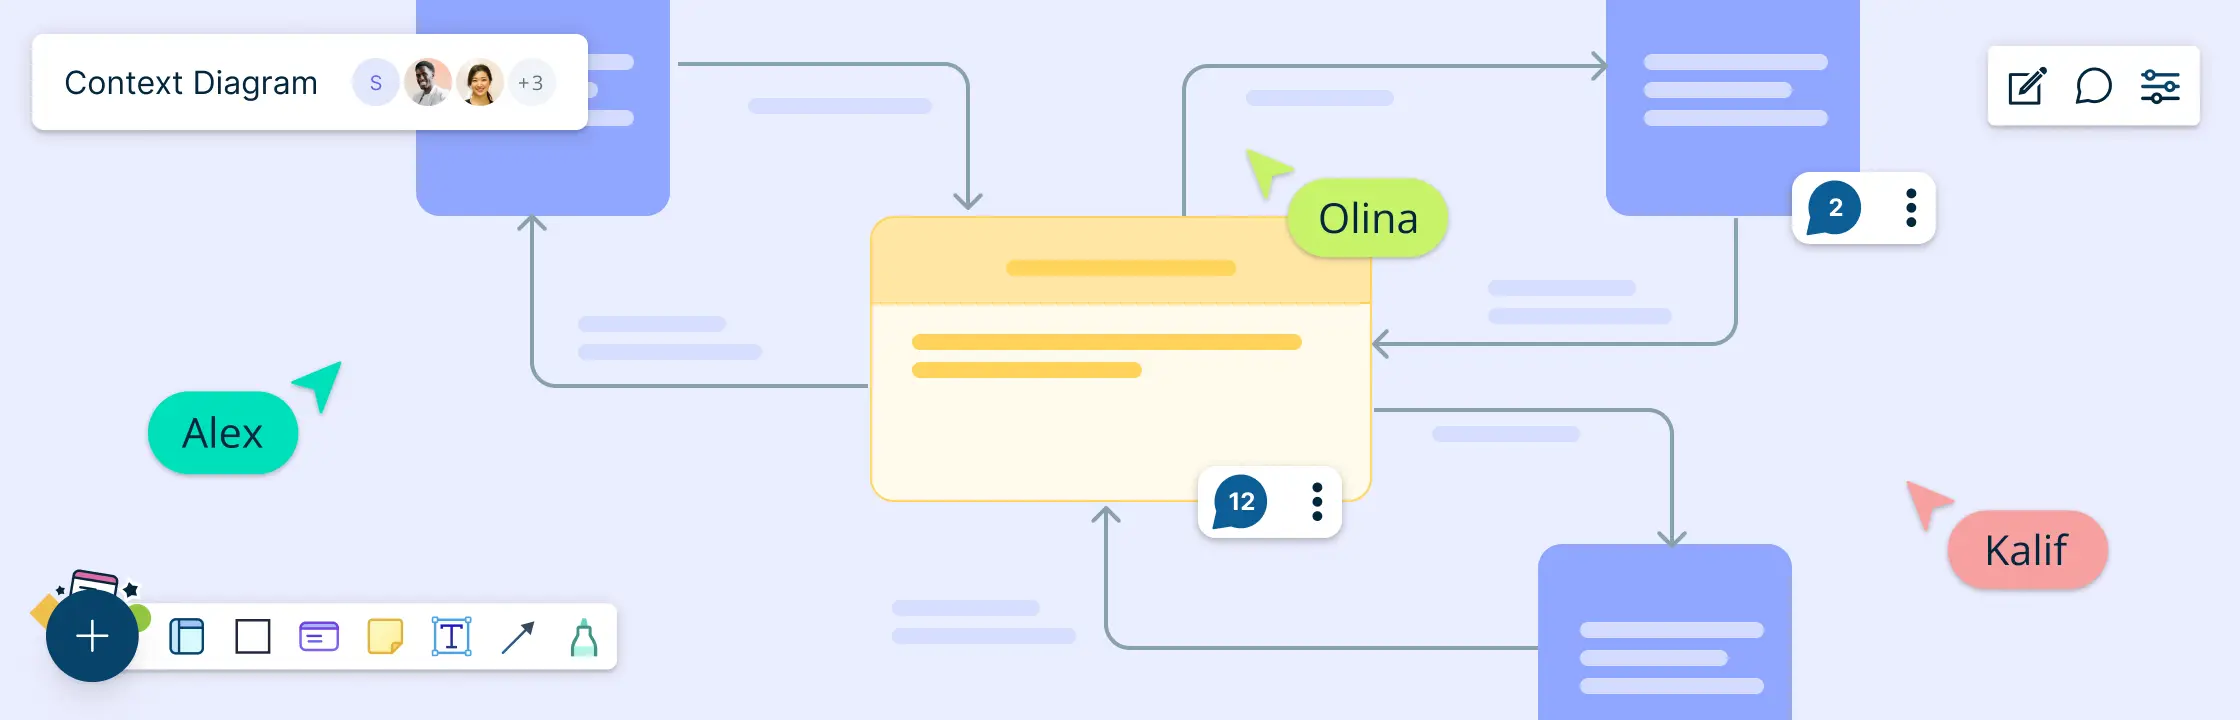
A context diagram is a high-level visual representation that provides an overview of a system and its interactions with external entities. It is a simple and easy-to-understand diagram that focuses on the relationships between the system and its environment.


The Difference between a Context Diagram and a Data Flow Diagram
This diagram is not to be confused with more intricate tools like data flow diagrams, which map out the path of data through a system, detailing processes and data stores. The context diagram’s strength lies in its simplicity, making it an ideal starting point for system analysis and ensuring all stakeholders have a unified understanding of the system’s boundaries and interfaces.
| Aspect | Context Diagram | Data Flow Diagram (DFD) |
| Level of Detail | High-level overview | Detailed representation of processes, data flows, and data stores |
| Focus | System boundaries and interfaces | Processes, data flows, and data stores within the system |
| Complexity | Simple | Can be complex, especially for large systems |
| Purpose | Establish common understanding, communication tool | In-depth analysis, detailed documentation |
| External Entities | External entities are depicted, showing interactions | Focus on internal processes, external entities are not detailed |
| Data Movements | Highlights data flow at a high level | Specifies data flows between processes, data stores, and external entities |
| Starting Point | Ideal starting point for system analysis | Develops from the context diagram to explore internal details |
Why You Should Use Context Diagrams
The creation of a context diagram is not just about drawing boxes and lines; it’s about bridging the communication gap between technical teams and stakeholders.
-
Clarifying System Boundaries: By delineating the scope of the system, a context diagram makes it clear what is inside and outside the purview of the project. This prevents scope creep and ensures that everyone is on the same page regarding the system’s limits.
-
Visualizing Interactions: Stakeholders can easily visualize how external entities like users, other systems, and data sources interact with the system. This visual representation is much more intuitive than textual descriptions, making it easier for non-technical stakeholders to grasp complex interactions.
-
Identifying Interfaces and Touchpoints: It highlights the points of interaction between the system and the external entities, which is crucial for understanding user journeys and system integration points.
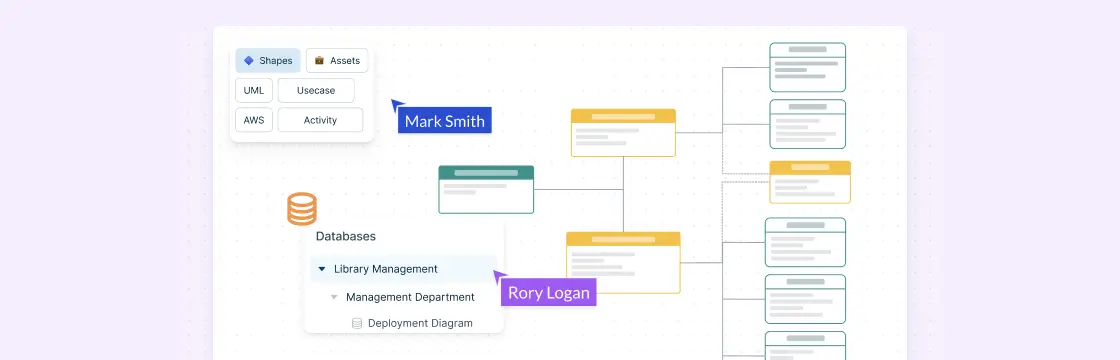
Using a tool like Creately, with its real-time collaboration features, can significantly enhance the process of creating and sharing context diagrams. Stakeholders can provide immediate feedback, and changes can be made on the fly, ensuring that the diagram always reflects the current understanding of the system.
Key Components of a Context Diagram
In the realm of context diagrams, data flow indicators are not just arrows pointing from one entity to another; they are lifelines that depict how information is processed and transferred within a system. These indicators are crucial for maintaining clarity and ensuring that stakeholders can easily follow the movement of data. The main components of a context diagram are:
- System Boundary: Defines what is inside and outside the scope of the system.
- External Entities: Identifies the users, systems, or processes that interact with the system.
- Data Flows: Shows the information exchange between the system and external entities.

The Advantages of Implementing Context Diagrams
A context diagram serves as a beacon in the complex sea of system interactions, guiding project managers and stakeholders to a clearer understanding of a system’s external relationships. Here are some key benefits of employing a context diagram in your projects:
-
Simplifying Complex Interactions: By distilling intricate system interactions into intuitive visuals, context diagrams make it easier for everyone involved to grasp the big picture without getting lost in the details.
-
Enhancing Project Management: With tools like Creately, you can not only visualize but also manage your projects more effectively. The platform’s visual kanban project management feature allows for clear task assignments, ensuring that every team member knows their responsibilities.
-
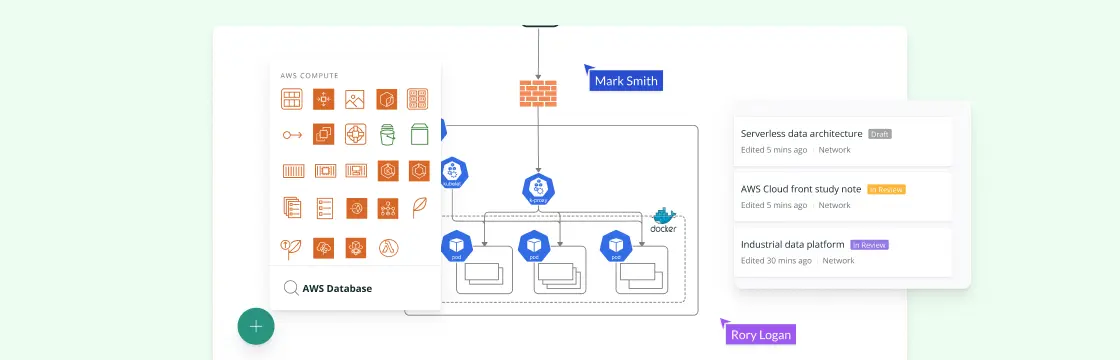
Streamlining Connections: A context diagram can be the starting point for delving deeper into system analysis. With Creately’s infinite canvas and drag-and-drop functionality, you can effortlessly connect to multiple system diagrams, such as a UML diagram, for a comprehensive overview.
These benefits highlight how a context diagram can be a powerful tool in the arsenal of technically savvy product managers, providing clarity and facilitating better communication and project management.
Steps to Creating a Comprehensive Context Diagram

Step 1: Identify the System Boundary
Define the scope of your system by outlining its boundaries. This boundary separates the system from its external environment and helps you focus on what is essential for your diagram. Clearly delineate what is part of the system and what lies outside of it.
Step 2: Identify External Entities
External entities are anything that interacts with your system but exists outside its boundary. These can be users, other systems, or even physical entities. List and name these external entities to establish a clear understanding of the system’s context.
Step 3: Identify Processes
Processes represent the functions or activities within your system. Identify and name the key processes that occur within the system boundary. Keep these descriptions high-level and avoid delving into detailed internal processes at this stage.
Step 4: Establish Data Flows
Determine the data flows between external entities and processes. These represent the information exchange between different components of the system. Use arrows to indicate the direction of data flow, and label each arrow with the type of data being transferred.
Step 5: Review and Refine
After creating the initial diagram, take a step back and review its components. Ensure that all relevant external entities, processes, and data flows are accurately represented. Make adjustments as needed to create a clear and concise representation of your system’s context.
Step 6: Consider Interactions
Think about how external entities interact with the system and each other. Identify any specific triggers or events that initiate processes within the system. This step adds depth to your context diagram, providing a more holistic view of the system’s dynamics.
Step 7: Document Assumptions and Constraints
Document any assumptions or constraints that may impact the system’s context. This could include technological limitations, regulatory requirements, or any other factors that influence the system’s interactions with its environment.
When Should you Use a Context Diagram?
Context diagrams are not just static representations; they are dynamic tools that can be utilized at various stages of a project’s lifecycle. Here are key project phases where a context diagram can be particularly beneficial:

-
Initial System Design: At the outset of a project, a context diagram serves as a high-level visual overview, ensuring all stakeholders have a common understanding of the system’s boundaries and external entities. This clarity is crucial for aligning the project’s scope and objectives.
-
Requirement Gathering: By detailing interactions between the system and its environment, context diagrams help in pinpointing specific requirements. They act as a reference point for discussions, making it easier to capture and validate stakeholder needs.
-
System Upgrades: When upgrading an existing system, a context diagram can highlight the areas of impact and dependencies, allowing for a more strategic approach to implementing changes.
-
Integration Planning: For projects involving the integration of new components or systems, context diagrams can illustrate how the new elements will interact with the current setup, aiding in the identification of potential integration points and challenges.
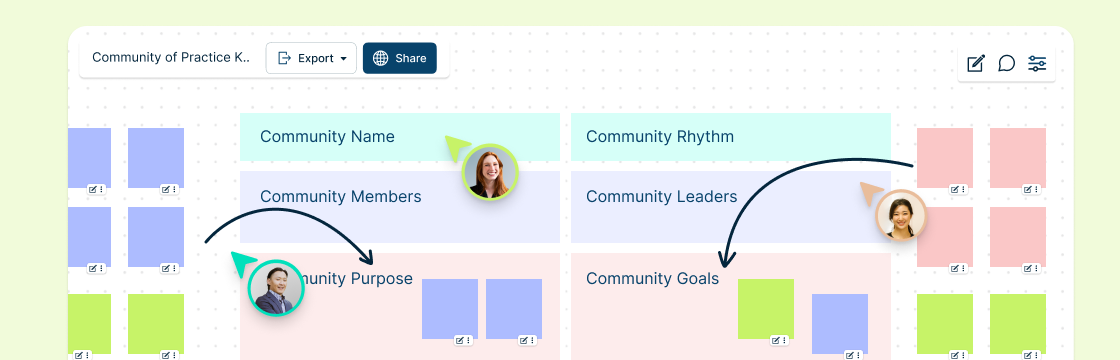
Leveraging tools like Creately can streamline the creation and sharing of context diagrams, with features like real-time collaboration and an infinite canvas, which are particularly useful during the brainstorming and iterative phases of these project stages.
Expert Tips for Enhancing Your Context Diagrams
Creating a context diagram that effectively communicates the scope and boundaries of a system is an art that benefits from a few strategic practices. Here are some tips to enhance your context diagram:
-
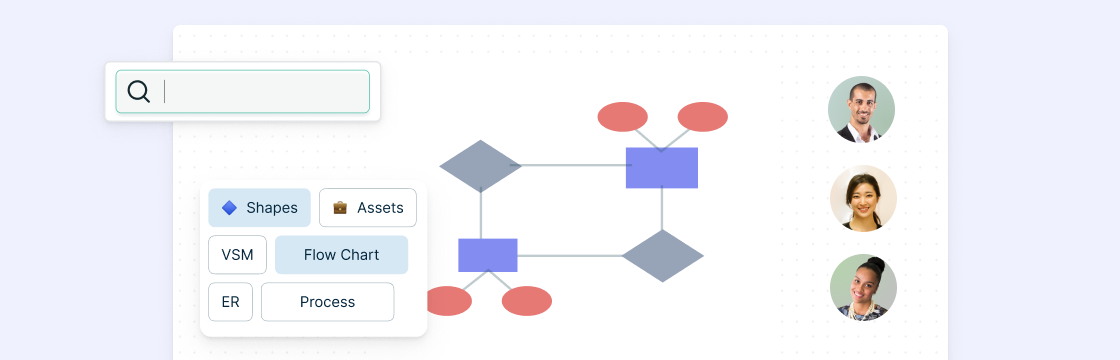
Employ Industry-Standard UML Shapes: Using universally recognized Unified Modeling Language (UML) shapes ensures that your context diagram is easily understood by stakeholders across different domains. Creately’s visual canvas comes equipped with specific industry-standard UML shapes, making it simple to create diagrams that speak a common design language.
-
Utilize Task Assignments for Project Management: A context diagram can be more than a static representation; it can be a dynamic tool for project management. With Creately, you can assign tasks directly on the diagram, turning it into an active component of your project management process. This integration of visual planning and task management helps keep the project aligned with the system’s architecture.
-
Regularly Revisit and Refine: Systems evolve, and so should their context diagrams. Make it a practice to revisit and update your context diagram to maintain its relevance. This iterative process can be facilitated by Creately’s infinite canvas, allowing for continuous expansion and refinement without the constraints of physical space.
A context diagram proves indispensable in system analysis, providing a streamlined overview of interactions. Its simplicity, distinguishing it from more intricate tools, makes it an ideal starting point, fostering clear communication—and informed decision-making.