A Profit and Loss statement summarizes your company’s financial performance in a concise and meaningful way. With this guide, we’ll explore what is a profit and loss template and give you a step-by-step guide to understanding and using this key financial document.


What is a Profit and Loss Template?
A Profit and Loss (P&L) template, also known as an Income Statement template, is a financial document that summarizes a company’s revenues, costs, and expenses over a specific period, usually monthly, quarterly, or annually. Businesses can use this template to assess financial performance and profitability. A P&L statement usually has sections for revenue, cost of goods sold (COGS), gross profit, operating expenses, operating income, and other income and expenses. By using a profit and loss template, businesses can systematically organize their financial data, analyze their operational efficiency, and make informed decisions to improve overall financial health.
Profit and Loss Templates
Hotel Profit and Loss Template

Blank Profit and Loss Statement

Profit and Loss Statement

Small Business P & L Statement

Components of a profit and loss template
A Profit and Loss template typically includes several key components that help to analyze the financial performance of a business over a specific period.
Header information
- Business name
- Statement title (Profit and Loss Statement or Income Statement)
- Time period covered (e.g., Month/Year ending [date])
Revenue section
- Sales: Total revenue generated from the primary business activities.
- Other income: Any additional income sources outside of regular sales, such as interest income or investment gains.
Cost of Goods Sold (COGS)
- Cost of Goods Sold: Direct costs associated with producing or purchasing the goods or services sold by the business.
- Other costs: Additional direct costs related to business operations.
Gross profit
- Gross profit: The difference between total revenue and the cost of goods sold, representing the basic profitability of the core business activities.
Operating expenses
- Marketing: Costs related to advertising and promotion.
- Salaries and wages: Employee compensation.
- Rent: Cost of renting business premises.
- Utilities: Expenses for essential services like electricity and water.
- Other expenses: Various operating costs not covered in the above categories.
Operating income (Loss)
- Operating income (loss): The result after subtracting total operating expenses from the gross profit. This figure represents the profitability of the core business operations.
Other income and expenses
- Interest income: Earnings from interest-bearing investments.
- Interest expense: Costs associated with interest on loans or debts.
- Other income: Any non-operating income.
- Other expenses: Any non-operating expenses.
Net income (loss)
- Net income (loss): The final result after accounting for all income and expenses, including taxes. This figure represents the overall profitability or loss of the business.
Tax information
- Income tax: Any income taxes payable during the period.
Footer
- Additional notes or comments
- Contact information for financial inquiries
How to Create a Profit and Loss Statement
An organization’s profit and loss statement is an essential part of its financial management. The following steps will help you create an effective P&L statement:
Step 1: Gather financial data
Collect all relevant financial data for the specific period you want to cover. This includes information on revenue, cost of goods sold (COGS), operating expenses, and any other income or expenses.
Step 2: Identify revenue
List all sources of revenue for your business. This may include sales, services, or other forms of income. Clearly detail each revenue stream.
Step 3: Determine Cost of Goods Sold (COGS)
Calculate the direct costs of producing goods and services. It could include materials, labor, and overhead. Subtract the COGS from the total revenue to get the gross profit.
Step 4: Outline operating expenses
List all operating expenses, such as marketing, salaries, rent, utilities, and other regular business costs. Categorize these expenses to provide clarity on your financial activities.
Step 5: Calculate operating income
Subtract the total operating expenses from the gross profit to determine the operating income. This figure reflects how well your business is performing in its core operations.
Step 6: Include other income and expenses
Account for any non-operating income (e.g., interest income) and non-operating expenses (e.g., interest expense). Add or subtract these from the operating income to get the total income or loss before taxes.
Step 7: Factor in taxes
If applicable, include income taxes in your P&L statement. Subtract taxes from the total income to get the net income.
Step 8: Create the P&L statement
Organize the information in a clear and concise table format. Use categories like Revenue, COGS, Gross Profit, Operating Expenses, Operating Income, Other Income/Expenses, and Net Income.
Step 9: Review and Analyze
Review the completed P&L statement for accuracy and consistency. Analyze the figures to understand your business’s financial performance, identify trends, and make informed decisions. Update the statement regularly, preferably on a monthly basis, to track changes and maintain accurate financial records.
What Makes a Good Profit and Loss Template
An effective Profit and Loss template is essential for financial management and decision-making within a company. A good P&L template has these key characteristics:
Clarity and simplicity
An effective P&L template should be clear and straightforward. Use a layout that’s easy for users to understand and input data. It’s easier to use when sections and categories are clearly labeled.
Comprehensive revenue categories
Include detailed revenue categories to provide a comprehensive view of income sources. This may include sales, services, and any other forms of income relevant to the business.
Customization options
The template should be customizable based on business needs. This may include adding or removing specific categories, adjusting formatting, or including additional notes and comments.
Visual elements for analysis
Consider incorporating visual elements such as charts or graphs to provide a visual representation of key financial metrics. This improves the template’s analytical capabilities.
When Do You Use a Profit and Loss Template
A Profit and Loss template is like a financial report card for a business. It helps regularly track and show how much money the business is making, where it’s coming from, and where it’s going. Businesses use it for planning, budgeting, and decision-making. Whether presenting to investors, applying for loans, or analyzing taxes, the P&L template is a key tool for understanding and managing a company’s financial well-being.
Create a Profit and Loss Template with Creately
Collaborate efficiently, maintain accuracy in financial reporting, and create a dynamic and visually appealing Profit and Loss statement with Creately.
Pre-built templates and customizable elements
Creately provide templates for financial documents, including P&L statements. You can start right away with a standardized template and customize it based on the specific needs and structure of their business. You can also easily start your profit and loss template from scratch using Creately’s intuitive table shape which you can quickly configure to merge cells, customize margins and insert shapes within it as you want. You can also use it as a frame and convert it into an action plan or Kanban board where you can easily assign roles, create tasks, and track progress.
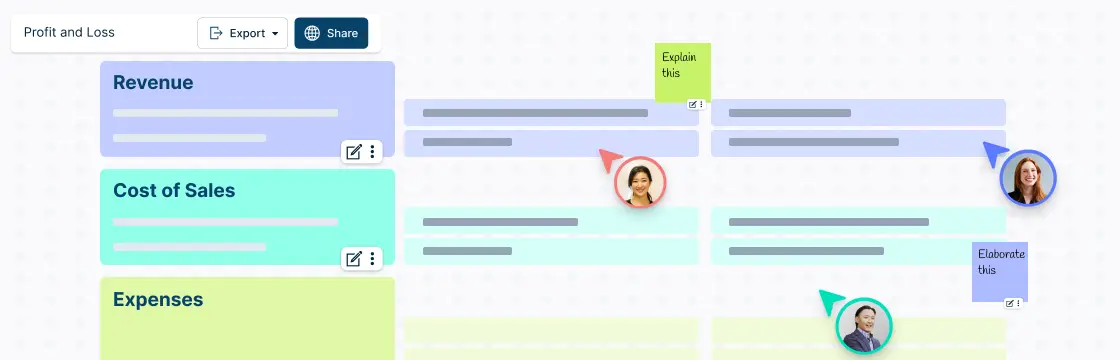
Real-time collaboration
Visual collaboration tools including live mouse tracking, commenting and synced previews, allow multiple team members to work on the P&L statement simultaneously. Quickly share the profit and loss template with collaborators and stakeholders with advanced sharing permissions and controls. Easily present your workspace with full-screen view mode - click on anyone’s avatar in the header to follow them or on your avatar to spotlight yourself.
Documentation and reporting
Collaboratively prepare reports and documentation with powerful documentation capabilities with per-item notes with tables, attachments and more. Team members can contribute to summarizing findings, insights, and recommendations in real-time. Seamless import and export data from spreadsheets and third-party apps directly on to the canvas or attach them to elements.
Easy-to-use visual tools
Boost the visual appeal and interpretability of the P&L statement by incorporating charts and diagrams directly within the document. Use Creately’s comprehensive shape libraries for over 70 diagram types and drag and drop interface and keyboard shortcuts, pre-made templates, preset color themes, Plus Create and more to create dynamic visuals.