How to get quantitative results on how your projects are performing? This is where project metrics come into play. But what are the essential project metrics that you should use? And how can you choose the right metrics for your project?
In this blog post, we will answer these questions and show you how Creately can help you create and monitor your project metrics.
What are Project Metrics?
Project metrics are quantitative measures that help you track, monitor and evaluate various aspects of your project. They help you assess the quality, efficiency, effectiveness and impact of your project activities and outcomes. Project metrics are essential for project management because they:
- Provide objective data and feedback on your project progress and performance
- Help you identify and address issues, risks and opportunities in your project
- Enable you to communicate clearly and transparently with your stakeholders and team members
- Support you in making informed decisions and taking corrective actions
- Demonstrate the value and impact of your project to your clients and sponsors
8 Essential Project Metrics in Project Management
There are many types of project metrics that you can use, depending on the nature, scope and goals of your project. However, some of the most common and important project metrics are:
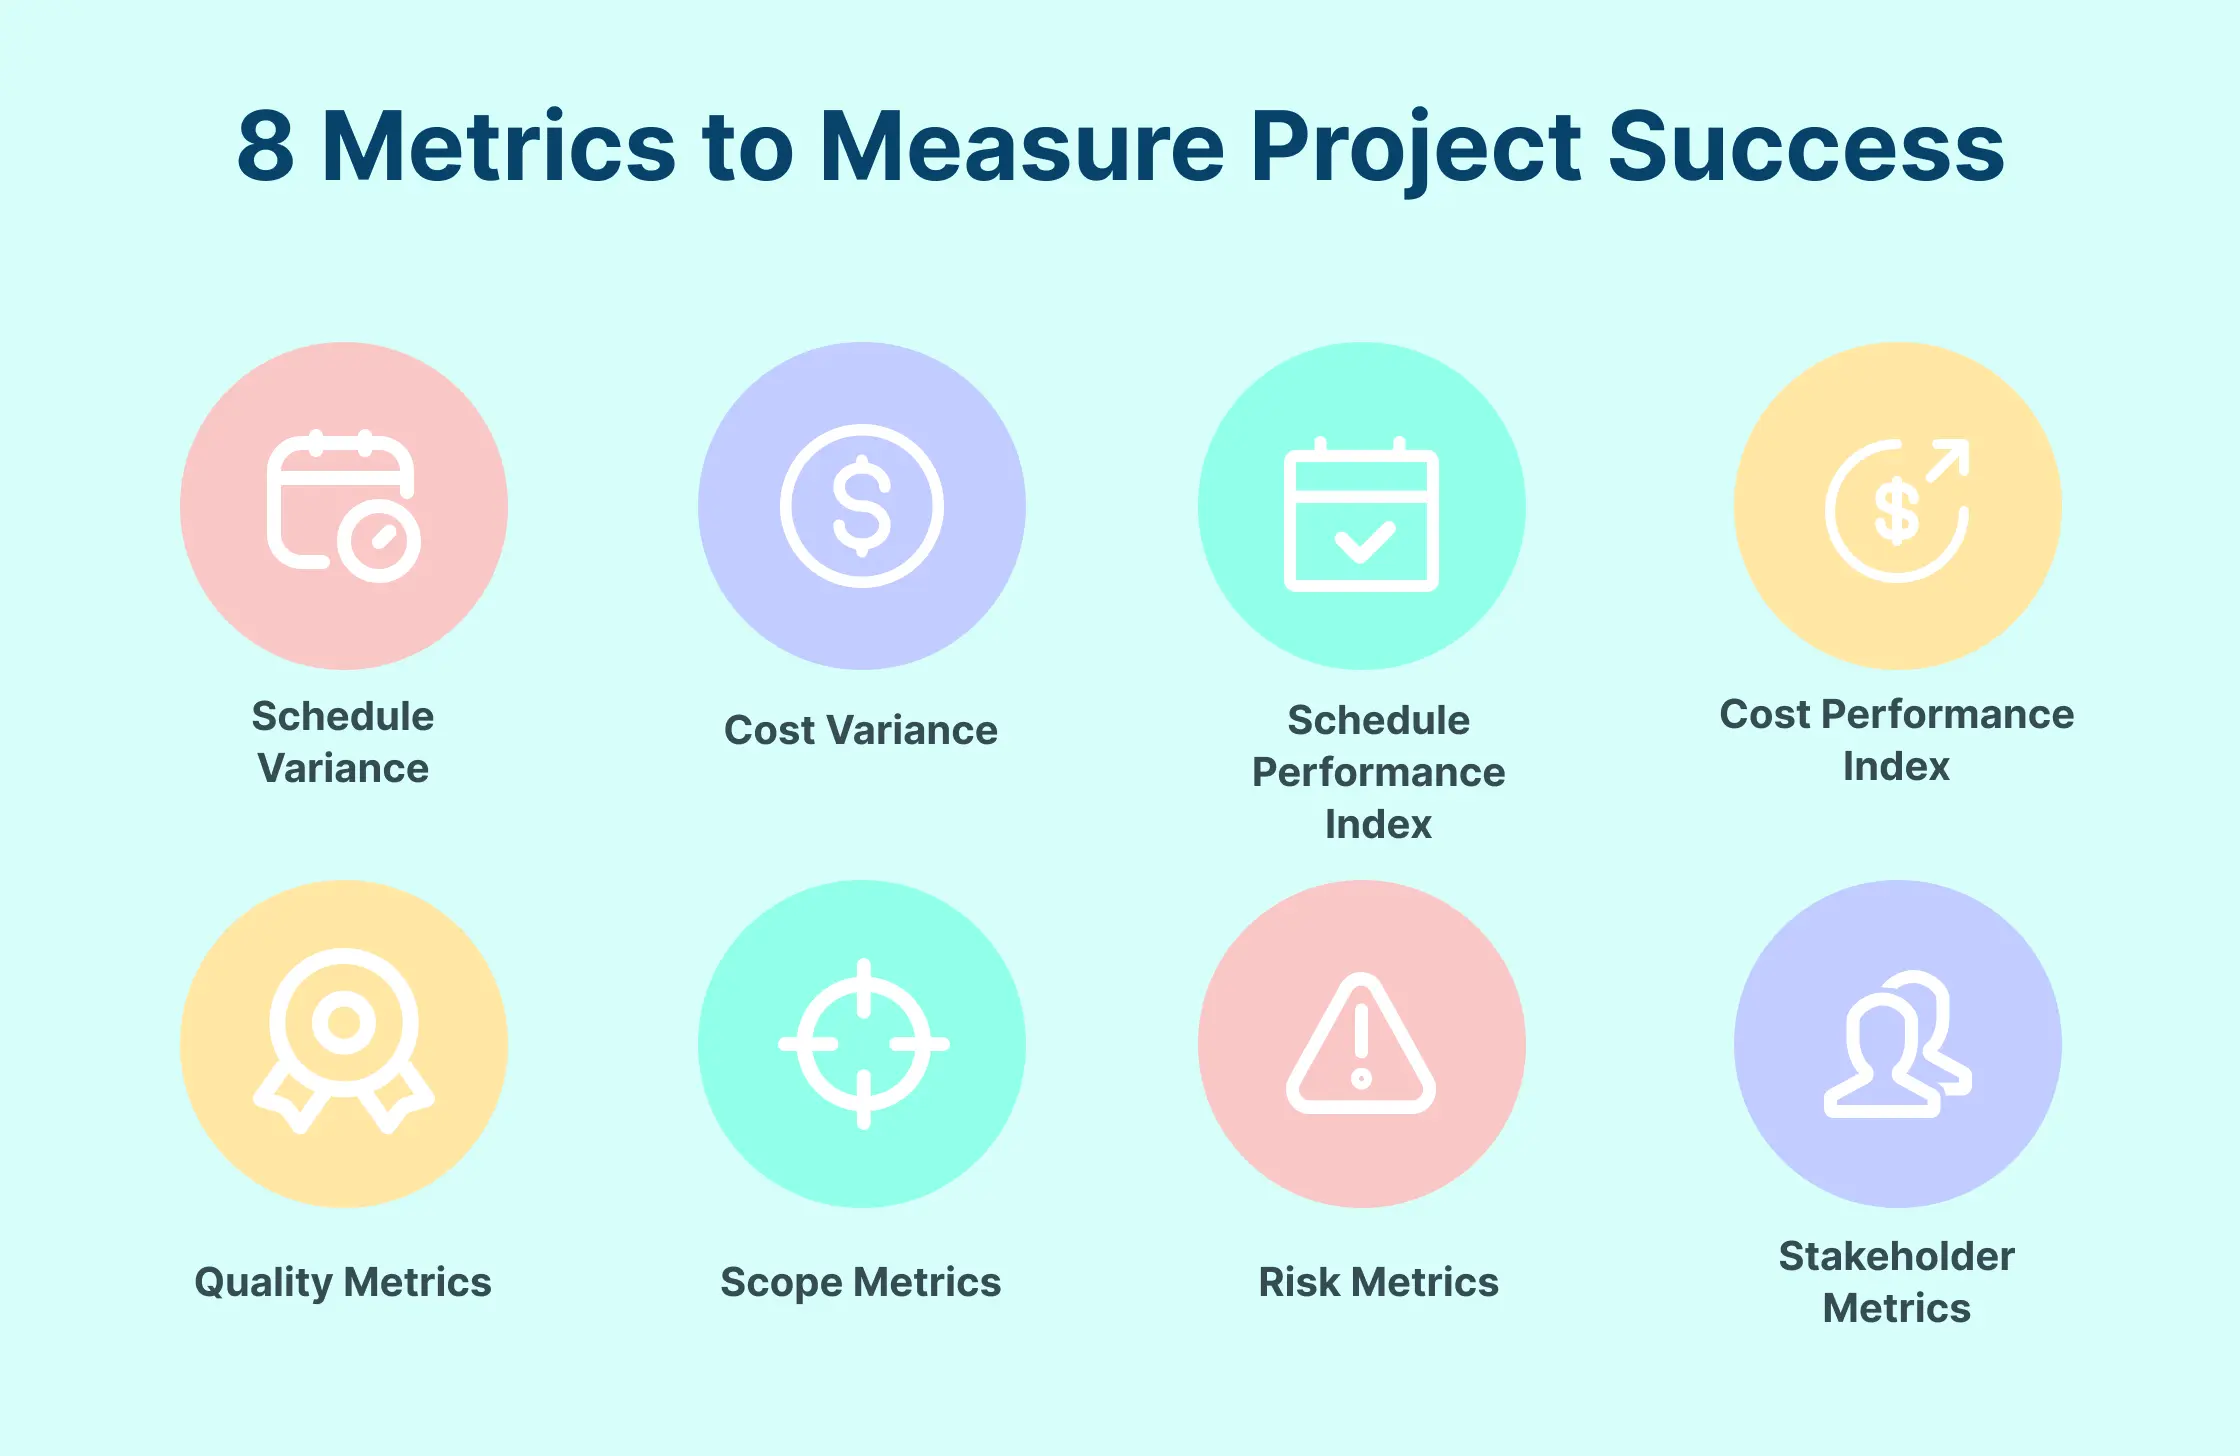
1. Schedule Variance (SV)
This metric shows how much your project is ahead or behind schedule. It is calculated by subtracting the planned value (PV) from the earned value (EV) of your project. A positive SV means that your project is ahead of schedule, while a negative SV means that your project is behind schedule.
2. Cost Variance (CV)
This metric shows how much your project is over or under budget. It is calculated by subtracting the actual cost (AC) from the earned value (EV) of your project. A positive CV means that your project is under budget, while a negative CV means that your project is over budget.
3. Schedule Performance Index (SPI)
This metric shows how efficiently your project is using time. It is calculated by dividing the earned value (EV) by the planned value (PV) of your project. An SPI of 1 means that your project is on schedule, while an SPI greater than 1 means that your project is ahead of schedule, and an SPI less than 1 means that your project is behind schedule.
4. Cost Performance Index (CPI)
This metric shows how efficiently your project is using resources. It is calculated by dividing the earned value (EV) by the actual cost (AC) of your project. A CPI of 1 means that your project is on budget, while a CPI greater than 1 means that your project is under budget, and a CPI less than 1 means that your project is over budget.
5. Quality Metrics
These metrics show how well your project meets the quality standards and expectations of your stakeholders. They can include measures such as defect rate, customer satisfaction, rework rate, error rate, etc.
6. Scope Metrics
These metrics show how well your project delivers the agreed scope and requirements of your stakeholders. They can include measures such as scope creep, scope change, requirement volatility, etc.
7. Risk Metrics
These metrics show how well your project identifies, analyzes and manages potential risks that can affect your project. They can include measures such as risk exposure, risk impact, risk probability, risk response, etc.


8. Stakeholder Metrics
These metrics show how well your project engages and satisfies the needs and expectations of your stakeholders. They can include measures such as stakeholder satisfaction, stakeholder involvement, stakeholder feedback, etc.
Benefits of Using Metrics in Project Management
Using metrics in project management can bring many benefits to you and your organization, such as:
- Improving the quality and efficiency of your projects by measuring and monitoring the progress, performance, and outcomes of your project activities and deliverables.
- Enhancing the communication and collaboration among your team members and stakeholders by providing clear and consistent information and feedback on the project status, issues, risks, and achievements.
- Increasing the accountability and transparency of your projects by establishing and tracking the roles, responsibilities, and expectations of each project participant and stakeholder.
- Boosting the confidence and trust of your clients and sponsors by demonstrating the value and impact of your projects and delivering on your promises and commitments.
- Supporting the continuous improvement and learning of your projects by identifying and analyzing the strengths, weaknesses, opportunities, and threats of your project processes and results.
How to Choose Metrics in Project Management
Choosing the right metrics for your project can be challenging, as there are many factors to consider, such as:
- Purpose and objectives of your project
- Expectations and requirements of your stakeholders
- Characteristics and constraints of your project
- Availability and reliability of data sources
- Feasibility and cost-effectiveness of data collection and analysis
To help you choose the right metrics for your project, you can follow these steps:
Define the goals and objectives of your project: What are you trying to achieve? What are the desired outcomes and benefits of your project? How will you measure success?
Identify the key performance indicators (KPIs) that align with your goals and objectives: What are the critical factors that indicate progress and performance of your project? How do they relate to your goals and objectives? How will you track and monitor them?

Select the metrics that measure the KPIs: What are the specific, measurable, achievable, relevant and time-bound (SMART) metrics that quantify the KPIs? How do they reflect the quality, efficiency, effectiveness and impact of your project? How will you collect and calculate them?
Define the baseline, target and threshold values for each metric: What are the current, expected and acceptable values for each metric? How do they compare to the industry standards, benchmarks or best practices? How will you set and communicate them to your stakeholders?
Establish the data collection methods, frequency and sources for each metric: How will you gather, store and validate the data for each metric? How often will you collect and update the data? Where will you get the data from? Who will be responsible for collecting and reporting the data?
Analyze and report the data using appropriate tools and techniques: How will you process, visualize and interpret the data for each metric? What are the tools and techniques that suit your needs and preferences? How will you present and share the data with your stakeholders?
Review and adjust the metrics as needed: How will you evaluate and improve the metrics over time? How will you incorporate feedback and lessons learned from your stakeholders? How will you adapt to changing circumstances and expectations?
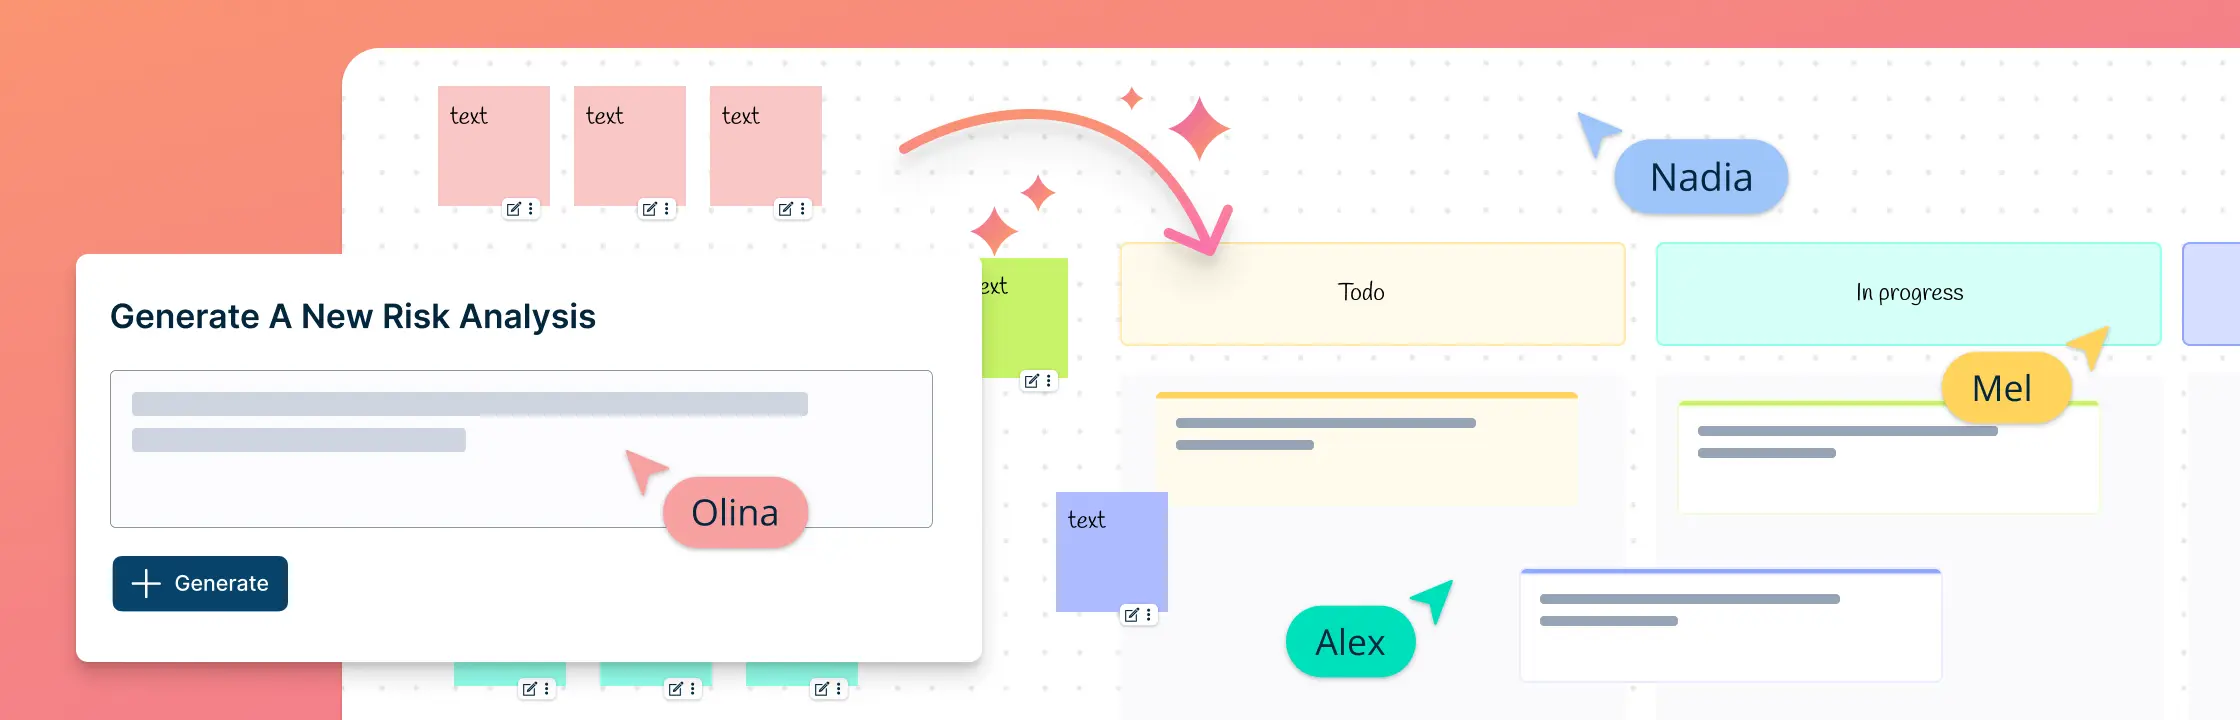
How Creately Helps to Create and Monitor Project Metrics
Here’s how you can use Creately to run and manage projects more efficiently and effectively.
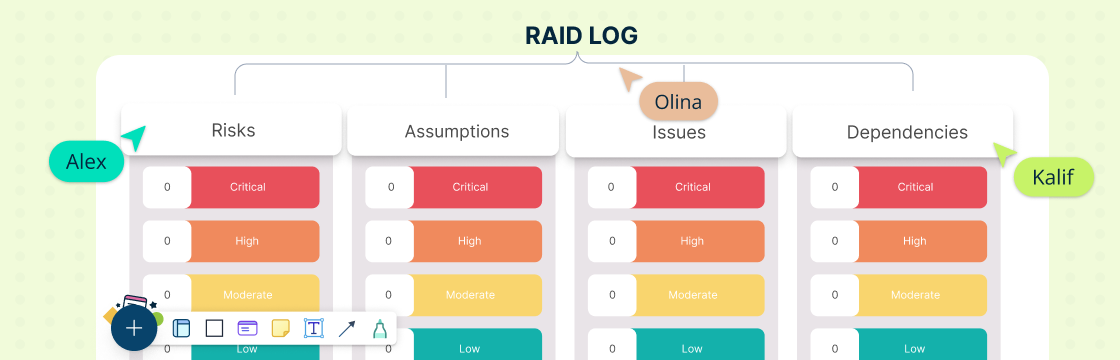
- Brainstorm ideas with your team and prioritize them with visual frameworks such as mind maps, affinity diagrams, SWOT analysis, etc. You can also use templates and shapes to create diagrams faster and easier.
- Track efforts and estimates and link everything to OKRs (Objectives and Key Results) to align your project goals with the organization’s vision and strategy. You can also monitor progress and performance with dashboards and reports.
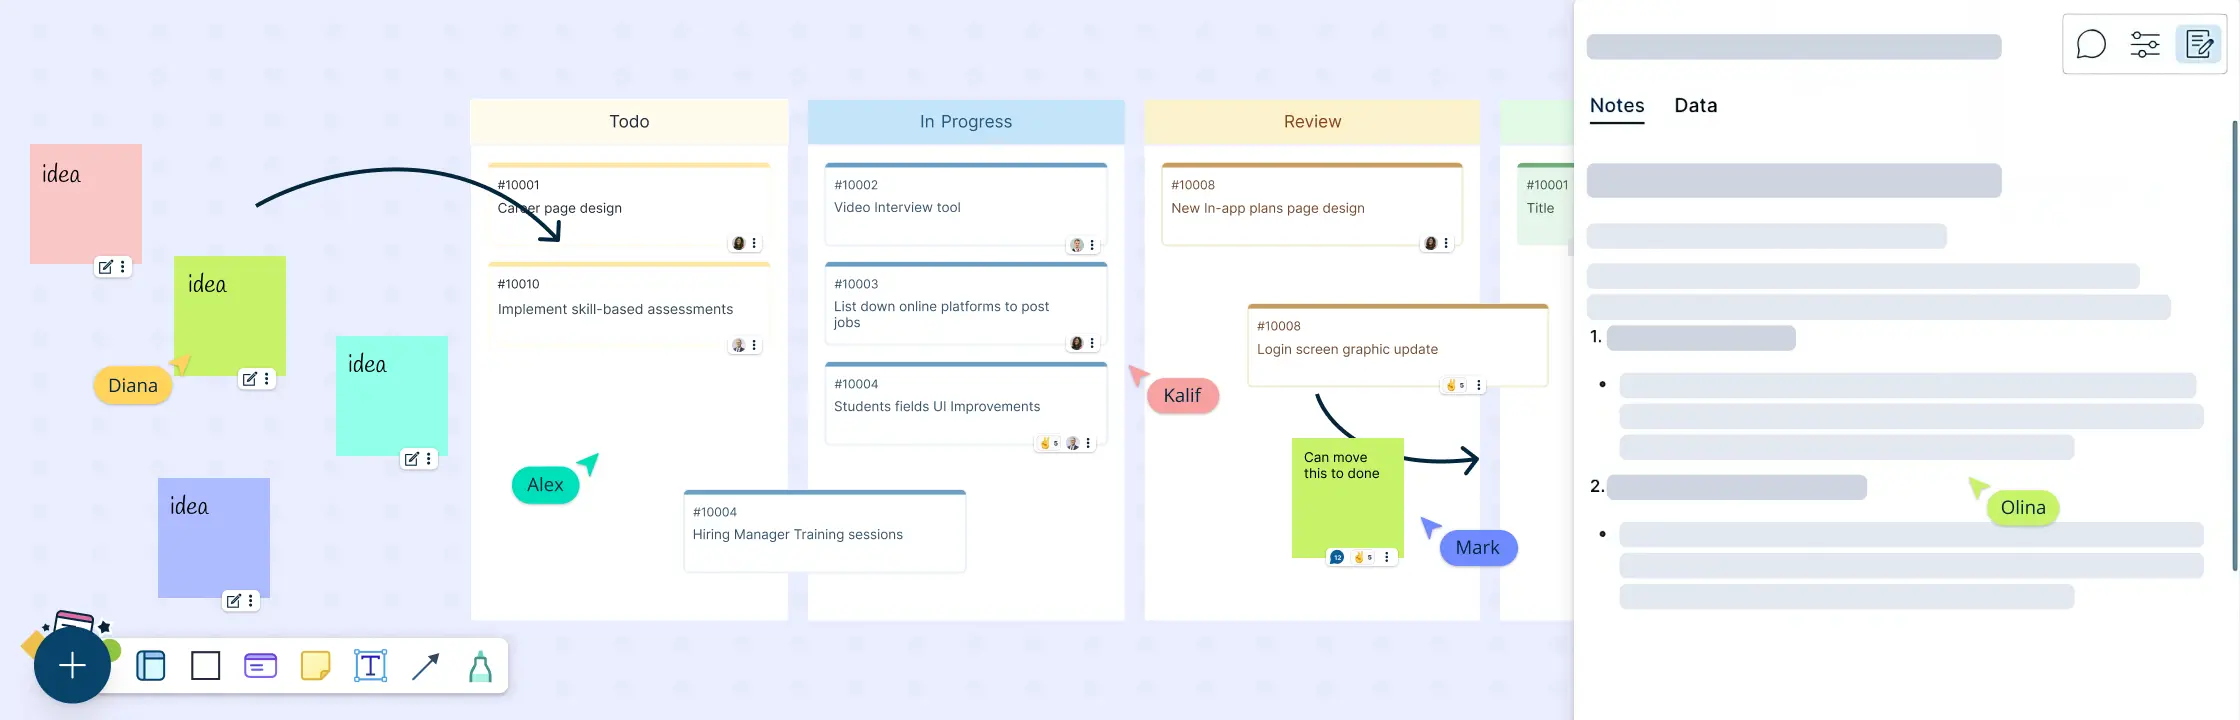
- Run agile projects with Kanban boards that help you visualize your workflow, manage tasks, collaborate with team members, and deliver value to customers. You can also customize your boards with columns, swimlanes, filters, labels, and more.
- Link important documents and attachments in the notes panel and embed spreadsheets and edit right within the app to streamline your project communication and documentation.
- Share your project management workspaces across the organization for real-time feedback with @mentions and in line comment threads. You can also control access permissions, set roles and responsibilities, and invite external stakeholders to view or edit your workspaces.
Click here to learn more about using Creately for project management.
Conclusion
Project metrics are essential for project management, as they help you measure and improve the performance and success of your projects. By using the 8 essential project metrics we discussed in this blog post, you can track, monitor and evaluate various aspects of your project, such as schedule, cost, quality, scope, risk and stakeholder satisfaction. You can also use Creately to create and monitor your project metrics easily and effectively.
We hope you found this blog post useful and informative. If you have any questions or feedback, please let us know in the comments below.
FAQs About Project Management Metrics
To ensure the accuracy and validity of your project metrics, you should:
- Use reliable and relevant data sources
- Use consistent and standardized data collection methods
- Use appropriate and robust data analysis techniques
- Validate and verify your data and results
- Cross-check your data and results with other sources