In the age of digital education, note-taking has taken on a new role. Where classes are held online over Zoom calls and lessons are explained with the help of an online whiteboard, note-taking is also increasingly becoming more digital in form.
Students and teachers are using online document editing apps and visual collaboration tools to record and share information instead of writing everything down in a book.
The use of visuals to map out ideas and to showcase interrelationships between them has become extremely popular over the last few decades, especially because visuals help the brain process information much faster and enhance memory and understanding better.
In this post, we’ll dive into simple yet powerful visual note taking techniques students and educators can use along with tips on how to use them effectively. Whether you choose to do it by hand or use a digital tool like Creately, these methods can help you record information much faster in a structural manner.
Templates provided are free and can be edited online; you can export them and take printouts or you can use them right away on Creately during your classes.
What is Visual Note-Taking?
Visual note-taking, also known as graphic visualization, visible thinking, and sketchnoting, combines both text and visuals to record information that is shared or experienced.
As opposed to the traditional text-heavy form, visual note-taking makes use of images, structuring, connectors, and text to record information in a way that makes sense to the note-taker and helps them understand and comprehend the information quickly and easily.
Visual Note-Taking Techniques
Visual note-taking represents information non-linguistically, which entails using pictures or drawings. While you can use sketches or doodles, you can also use more structural methods such as the ones listed below. You can also combine both sketching and the following diagram types for visual note-taking in a way that best suits you.
Mind Maps
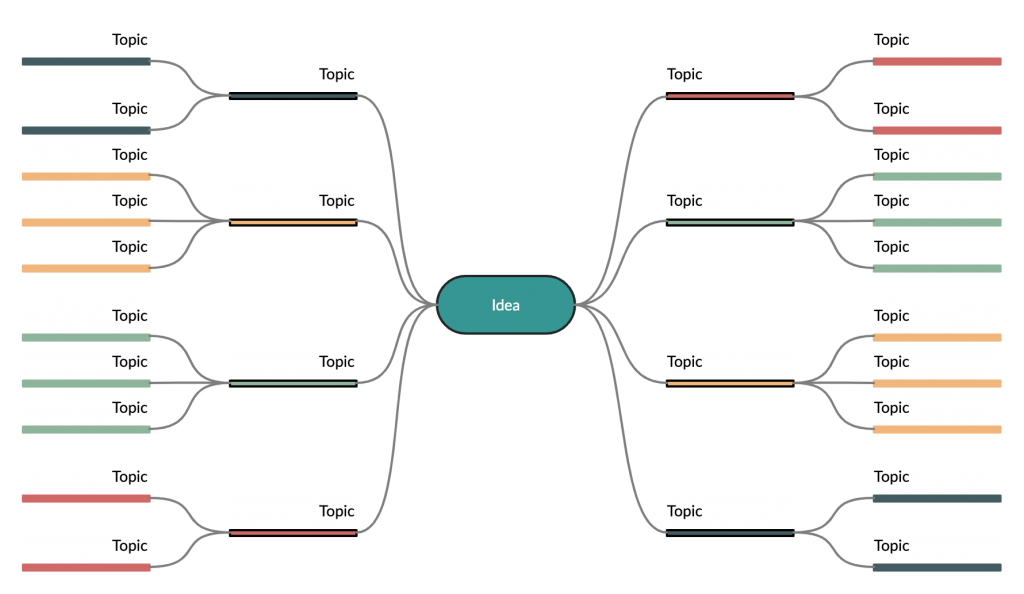
Mind maps are an easy yet powerful way to capture thoughts and visualize them in a logical manner. The tool focuses on relationships and hierarchy, hence it’s ideal for simplifying complex ideas.
A mind map connects information around a central idea or topic. It has subtopics branching out of the central idea, revealing greater details about the subject and how they are interrelated.
During note-taking, you can use mind mapping to record ideas without losing what’s about to come next. Plus it provides a good structure to your notes and helps them from getting messier or too crowded. Even if you are not adding any drawings, you can incorporate the elements of color and connectors into your mind mapping activity to make it more effective in terms of visual note-taking.
How To Do a Case Study Analysis Using Mind Maps
Concept Maps
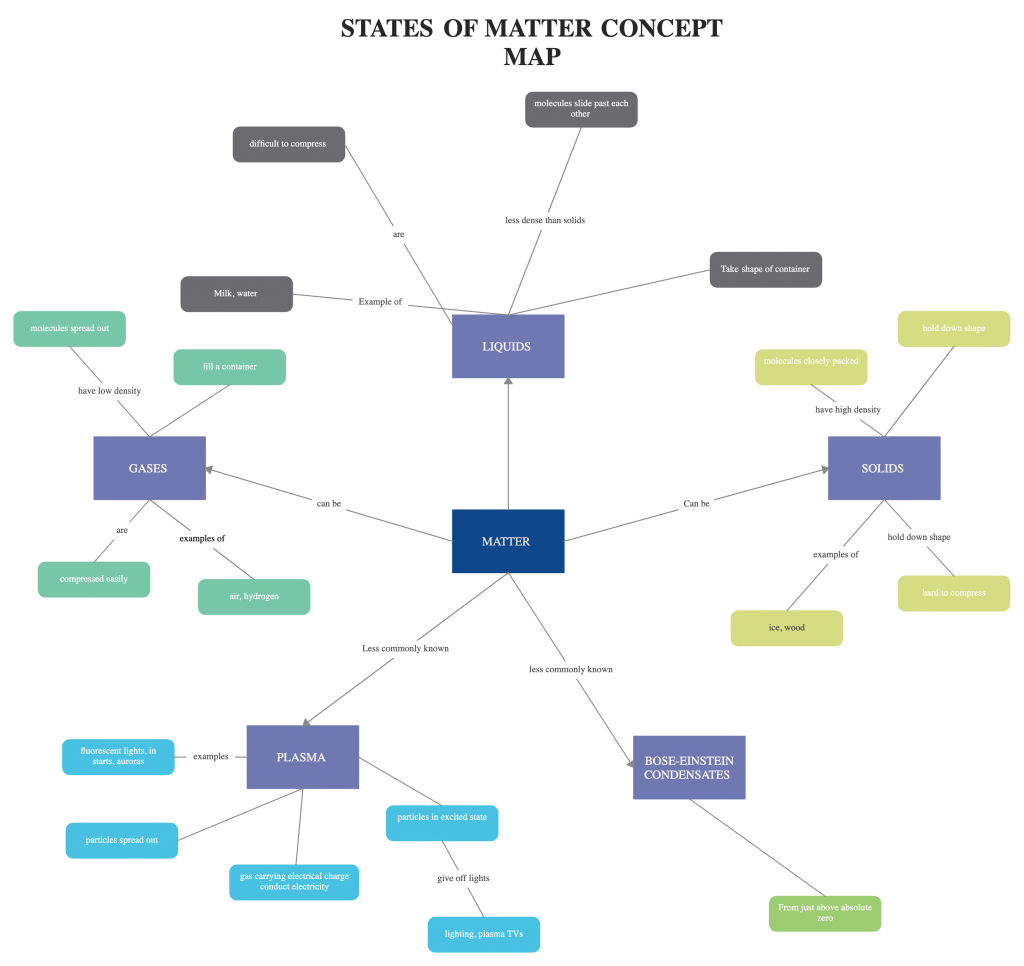
Concept maps are another great way to record knowledge. It also incorporates keywords, shapes, and connectors to visualize concepts. The central topic goes at the center and related ideas are placed surrounding it. They are then connected by arrows that have a brief explanation (1-2 words) on them to explain the type of relationship between the two ideas.
By using a concept map for note-taking you can easily organize your ideas, dig deeper into concepts, and find relationships that you would have missed when you heard about it first.
The Ultimate Guide to Concept Maps
How to Use Concept Maps for Studying and Organizing Information
Flowcharts
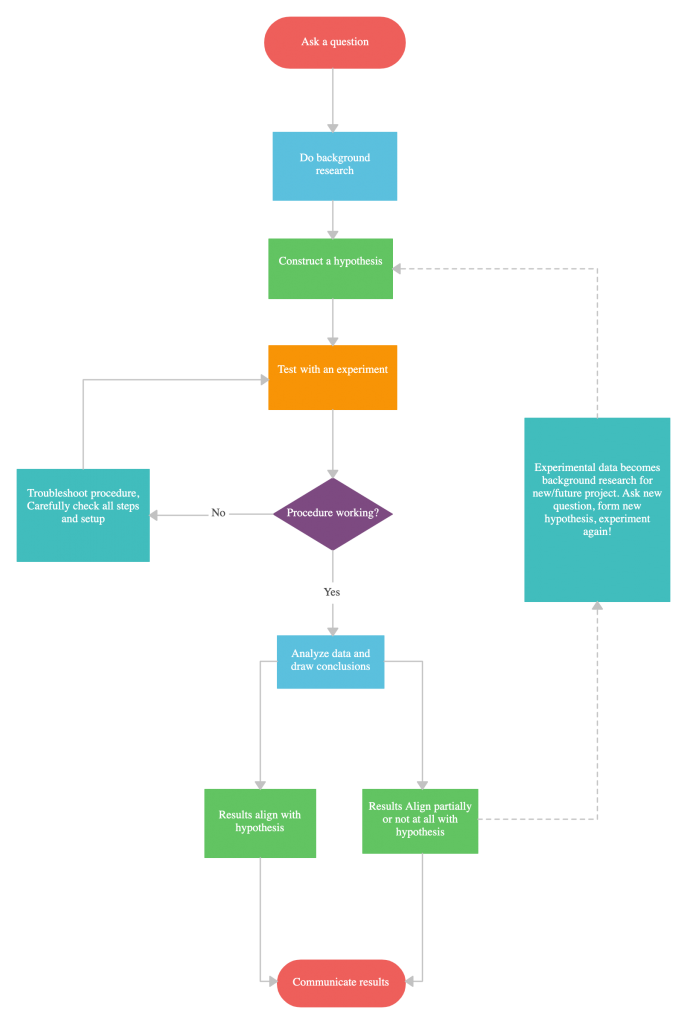
Flowcharts visualize the flow of a process or event step by step leading to its outcome. It’s a great tool to graphically capture the thinking process in a logical and organized manner during note-taking.
In business use, drawing a flowchart involves the use of many symbols, however, for education purposes, the basic shapes of Start and End (oval), Process (rectangle), and Decision (diamond) will suffice. Arrows are used to connect the steps and indicate the flow of action.
Flowcharting Basics: How to Create a Simple Flowchart
Thinking Maps
Thinking maps include 8 visual-verbal learning tools that help visualize our thinking and thus give concrete images to abstract thoughts. Thinking maps enable meaningful learning as they help organize ideas and information in a way that is easy to understand.
They also help break down complex information into easily comprehensible sections and discover connections in between. And they can be very useful during critical and creative thinking exercises.
They include,
- Circle Map – Defining in context and brainstorming
- Bubble Map – Describing using adjectives
- Flow Map – Ordering and sequencing
- Brace Map – Depicting the whole of something and its parts
- Tree Map – Classifying and grouping
- Double Bubble Map – Comparing and contrasting
- Multi-flow map – analyzing causes and effects
- Bridge map – Seeing analogies
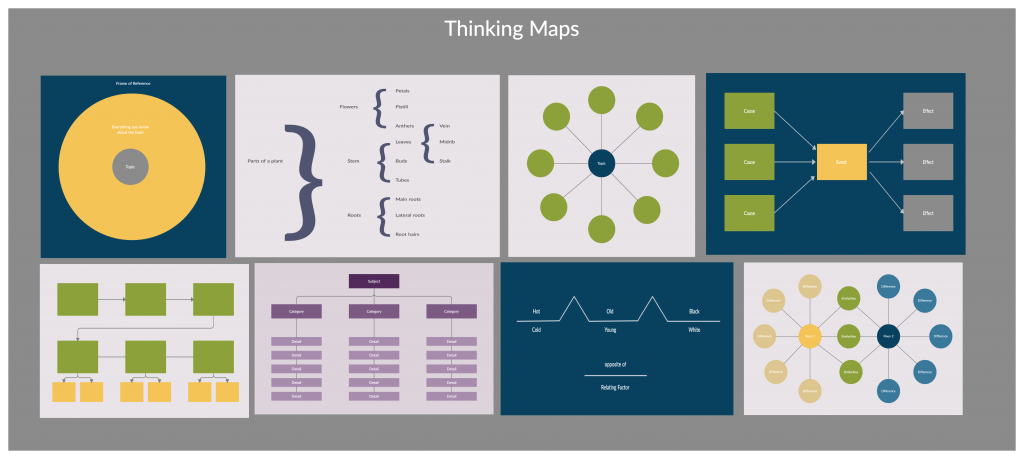
Refer to our guide to effectively using thinking maps to learn how to effectively use them in the classroom for note-taking.
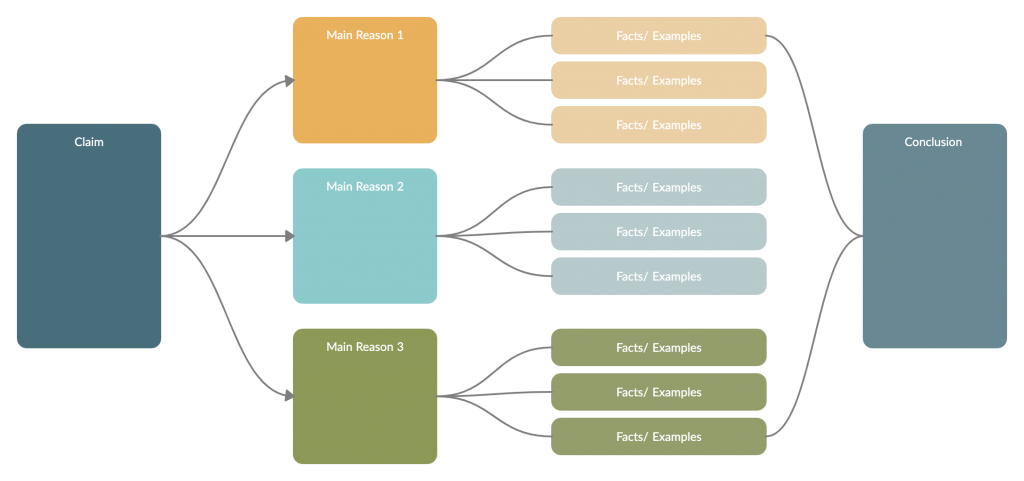
Graphic Organizers
A graphic organizer is a tool that is used to organize information and ideas in a way that is easy to comprehend and internalize. It combines text, shapes, and connectors to simplify concepts and show connections between their elements.
Persuasion maps, sequence charts, story maps, learning maps are some of the popular types of graphic organizers out there.
Here are 19 types of graphic organizers with templates that you can easily utilize for visual note-taking during lessons.
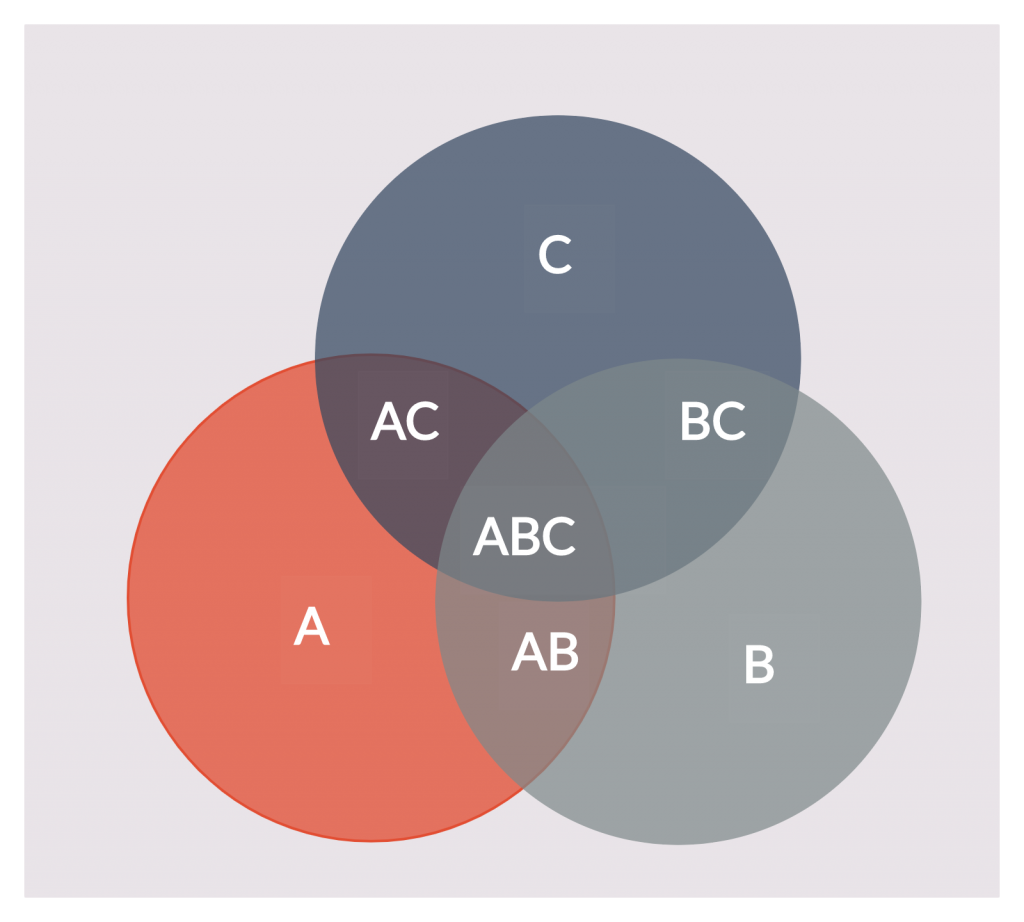
Venn Diagrams
Venn diagrams are used to compare ideas, concepts, or items. At a glance, they reveal the differences and similarities between or characteristics of two or more things. During a lesson where the teacher is comparing two concepts, students can use Venn diagrams to note down connections and disparities between them.
Visual Note Taking Tips
Like any other note-taking method, visual note-taking also may vary based on the user. Whether you would like to rely on sketching or a well-structured method like mind mapping, here are a few tips on making your visual-notes more effective.
Adding Images
The purpose of adding images to your visual notes is to make them more memorable and comprehensible. Therefore, any illustration you add should always be directly related to the information in order to avoid confusion.
Always write down information before adding illustration, and always accompany an image with text in your notes to provide more clarity.
Adding Text
Equally important as visuals in visual note taking is text. The good thing is that you don’t have to write down everything your teachers say – only capture the key points and meaningful quotes without trying to summarize everything.
When adding text, use them in a visually appealing way.
- Include different fonts and font sizes, so that you can emphasize the important words or sentences on your notes
- Avoid long sentences by adding symbols, abbreviations, and images
- Avoid making lists or creating outlines and rely on chunking information to leave as much white space for clarity as possible
- Add containers (boxes, circles, thought clouds, etc.) around the text to provide more structure and for emphasis
Using Connectors
Use arrows and lines to connect ideas and highlight relationships or the flow between them. They help easily distinguish between the key concept and supporting ideas.
Structuring
Follow a proper structure to maintain a sensible flow of information. Place the key topic or central theme in the middle of the canvas. Related pieces of information are to be added surrounding the topic at the center.
Or you can organize it from top to bottom, with the key subject at the top and the other pieces of information cascading down, creating levels of hierarchy.
Place the unfamiliar concepts or words on one side of the canvas under a further research section, to easily spot them and as a reminder.
- Use a framework for your visual notes; the techniques discussed above can be used here
- Use white space as much as possible to separate major ideas
- Limit your notes to one idea or concept per page
Using Colors
Colors, like different font types and sizes, are another great way to highlight key areas on your notes and differentiate between information. Use between 2-3 colors to keep things clear.
What’s Your Take on Visual Note-Taking?
Human beings are highly visual – from cave paintings in the stone age to modern-day emojis, communicating visually is something that we’ve always loved and visuals accompanied by text have always been a powerful way to capture and share ideas.
Where 65% of the population identifies themselves as visual learners, visual note taking is a no-brainer. And learning the visual note taking techniques above can help you one way or the other.
Let us know any other visual note taking technique that you love to use in the comments section below.