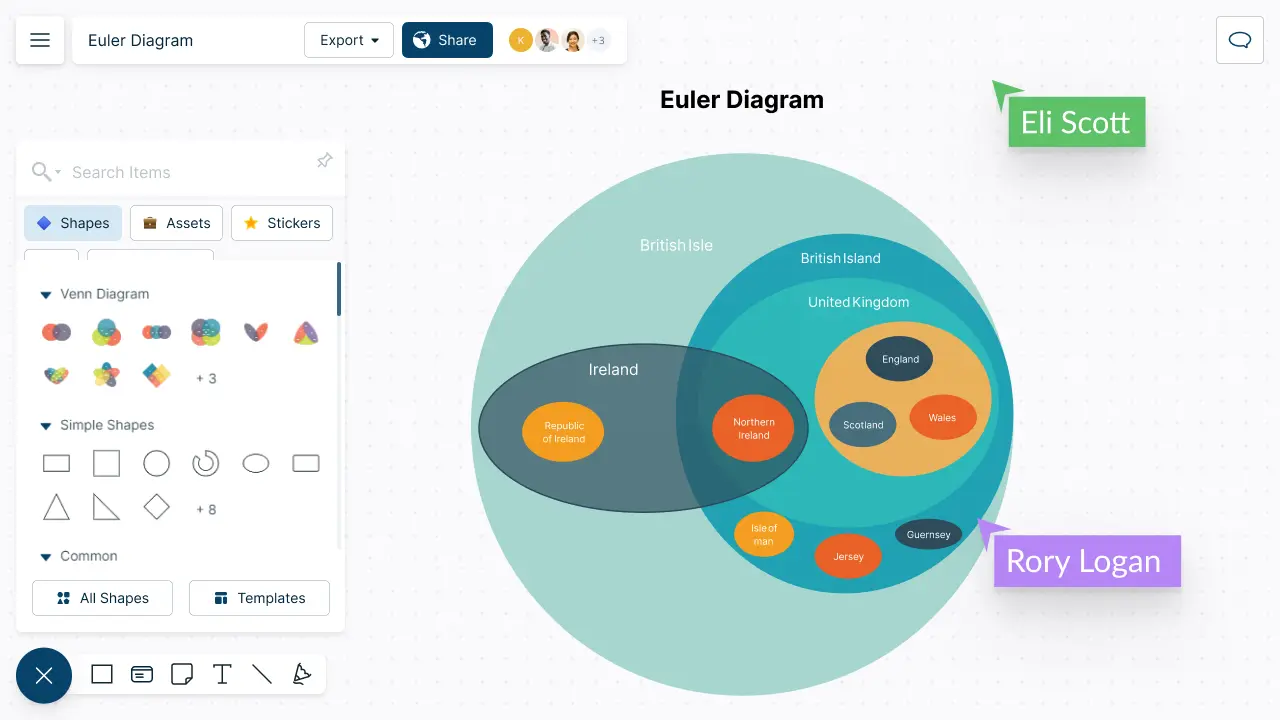
Euler Diagram Generator
Effectively Visualize Complex Hierarchies
Identify and understand relationships between groups and sets by creating effective and creative Euler diagrams.
- Intuitive visual tools to map relationships between groups & sets.
- Multiple Euler diagram templates to get started quickly.
- Preset color themes & advanced formatting for easy customization.
Over 10 Million people and 1000s of teams already use Creately


How to make an Euler Diagram?
Create Euler Diagrams Effortlessly

-
Euler diagram templates for various scenarios.
-
Using custom color themes and fonts, highlight & label contours & zones.
-
Draw Euler diagrams with non-convex contours using freehand drawing.
-
Import or drag-drop images, graphics, etc. to create visually dynamic Euler diagrams.

Add More Context to Your Euler Diagram
-
Add more information on various zones with integrated notes.
-
Shape libraries for over 50 diagram types to extend Euler diagrams further.
-
Create interactive presentations with built-in tools such as frames, view mode, etc.
Collaborate with Others, Anytime, Anywhere

-
Real-time collaboration to work with students or colleagues on a shared canvas.
-
Comment with context to have discussions & follow-ups on the same canvas. Async!
-
Offline sync to keep your work always synced.
-
Export your diagrams in multiple image formats for embedding, printing, or sharing.
INTRODUCING

 Templates
Visualize process and user insights with AI templates

Accessing Creately VIZ
What is an Euler Diagram?
When to Use an Euler Diagram?
Euler diagrams are used in a variety of fields, including mathematics, logic, computer science, and linguistics, to help clarify and explain complex relationships. They are also used in areas such as information visualization, data analysis, and decision-making, to help communicate information in a clear and comprehensible way.
How Can a Euler Diagram be Used Collaboratively with Your Team?
Euler diagrams can be used collaboratively in a number of ways to support group decision-making, communication, and problem-solving. For example:
- Brainstorming and idea generation
Euler diagrams are a useful tool in group brainstorming as they enable the representation and visualization of the connections between various ideas and concepts. They are also useful to highlight the relationship between different stakeholders or interests, to help identify common ground and areas of conflict.
- Decision making
Euler diagrams can aid group decision making by providing a visual representation of the connections between options and their likely results. They help reduce uncertainty and enhance comprehension, make it easier for teams to reach an agreement.
- Collaborative planning
Euler diagrams can help teams with planning and managing complex projects by displaying the connections between various tasks, resources, and stakeholders. By providing a clear understanding of the dependencies and connections between project elements, Euler diagrams can enhance awareness and help to uncover potential risks and challenges.
- Communication and information sharing
Help team to communicate and exchange information by visually displaying the connections between various pieces of information, data, or concepts. By simplifying complex information through visualization, Euler diagrams can make it easier for groups to understand data better.
In the examples above, it shows how Euler diagrams promote collaboration and consensus building by allowing all members of the group to see and understand the relationships between different elements. By visualizing complex information, Euler diagrams can enhance communication, streamline decision-making processes, and increase the chances of positive outcomes.
How to Create an Euler Diagram?
-
Create a Creately workspace and share it with others who you wish to collaborate with. You can simply add them as collaborators with edit access to work together in real-time. You can use real-time mouse cursors and synced previews to easily track the changes other participants make in the workspace.
-
Enable Creately’s basic shape library or the comprehensive Venn and Euler diagram templates library.
-
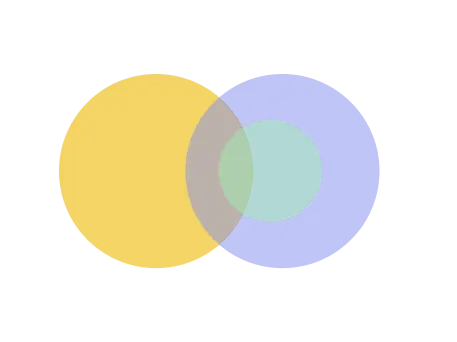
Drag and drop circles or any relevant shapes onto the canvas to signify the number of groups being used in the diagram.
-
Identify the links between the groups and link the relevant shapes together to visualize the information.
-
Continue repeating this process until all the relevant groups have been sorted and linked respectively.
-
Use any of the multiple design features offered by Creately to color-code, highlight, and make your Euler diagram dynamic and presentable.
-
Finalize the Euler diagrams and share them with others in various image formats.
Create Your Euler Diagram Online with Editable Templates


FAQs about the Euler Diagram Generator
Streamline Your Workflows by Integrating with the Tools You Love
Creately integrates with the tools your teams use every day and supports your team’s workflow seamlessly.


Why is Creately a Better Euler Diagram Generator
Creately is the intelligent visual platform enabling visual collaboration, knowledge management and project execution.
100+ proprietary features deliver a flexible, no-code visual platform, expertly-tuned for ease of use.
Infinite Visual Canvas
Visually create and organize any structure you imagine. Drag drop shapes or datasets, embed external content.
Real-Time Collaboration
Work remote or hybrid with realtime cursor tracking, synced previews and proper in-context comments and tasks.
Custom Databases
Create custom databases for any kind of information from tasks, HR personnel records to matters for law firms.
Data Driven Docs
Create docs and notes to go deeper from the high-level visual views. 2 way link to other docs, shapes or data with @mentions.
Professional Diagramming
50+ types of standard diagrams with 1000+ specially designed shapes and connectors enable blazing fast diagramming.
Project & Task Management
Use built-in agile project management tooling or integrate with your favourite project management tool to keep work flowing.
Enterprise Grade Security
ISO 27001, SOC 2 - Type 2, Data Residency & Up-time SLAs to collaborate securely with your entire organization.
Powerful Visual Modelling
Visuals that are backed by databases, update once, reflect in multiple views type of workflows.


Enterprise-Grade Security and Compliance
We’re dedicated to keeping your data private, secure and safe. Creately is SOC2-Type 2 and ISO 27001 certified and GDPR compliant. We offer flexible data residency options in USA, EU and Australia to our enterprise customers. Creately Security
Just Plug and Play

An easy-to-use interface with a minimal learning curve. Simply Sign-In using your work email to automatically add team members to the enterprise plan. No installation required.
