Synoptic Table Maker
Easily Organize and Compare Information
Easily identify key similarities and differences between options and discover patterns and trends in the data to make more informed decisions.
- Powerful table shape to create comparison tables & matrices
- Built-in collaboration tools for team brainstorming sessions
- Multiple synoptic table templates to get a head start
Over 10 Million people and 1000s of teams already use Creately


Create a Logical Hierarchy of Your Ideas

-
Quickly group information together with intuitive drag and drop tools.
-
Add detailed docs, attachments, links and more with integrated notes.
-
Highlight information and sketch out ideas with freehand drawing.
-
Intuitive tables and grids to create customizable synoptic tables with ease.

Keep Your Ideas Organized
-
Import videos, photos, documents, screenshots, etc. on the topic onto the canvas.
-
Highlight key areas with powerful styling and formatting options.
-
Find information easily on complex synoptic tables with universal text search.
Explore Concepts Collaboratively

-
Collaborate with peers on a shared canvas with real-time mouse cursors.
-
Comment with context, have discussions and follow-ups on the same canvas. Async!
-
Share your synoptic table with others using secure sharing links.

Deliver Compelling Presentations
-
Built-in tools to quickly create interactive presentations right on the canvas.
-
Export synoptic tables as SVGs, PDFs, and PNGs to publish, present, print, or share.
-
Navigate to specific points on your synoptic table using frames.
INTRODUCING

 Templates
Visualize process and user insights with AI templates

Accessing Creately VIZ
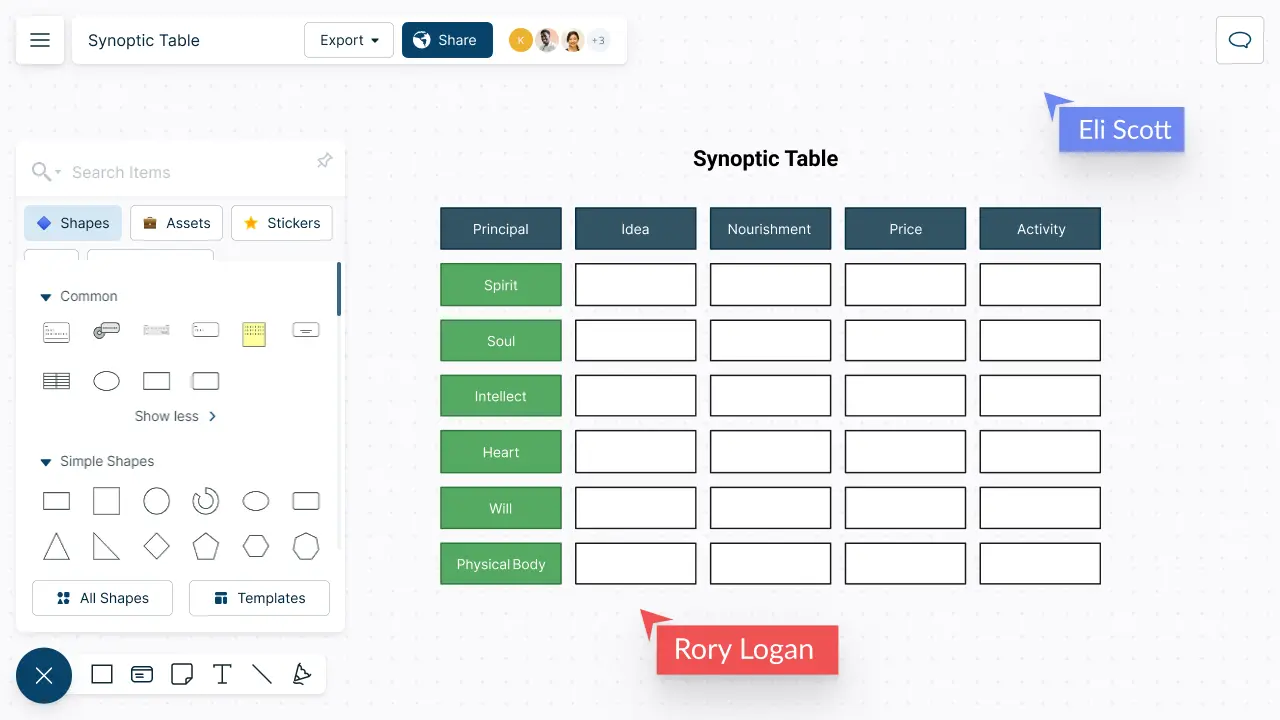
What is a Synoptic Table?
When Can Teams Use Synoptic Tables to Organize Information?
Synoptic tables are a useful tool for teams to organize and present information in a structured and concise way. Here are some examples of how teams can use synoptic tables:
- Project management: A team can use a synoptic table to track the progress of a project. The table can include columns for tasks, due dates, assigned team members, and completion status. This allows the team to quickly see which tasks are on schedule and which ones need attention.
- Sales tracking: A sales team can use a synoptic table to track their leads and sales. The table can include columns for lead source, contact information, sales stage, and conversion rate. This allows the team to easily track their progress and identify areas where they need to focus their efforts
- Customer support: A customer support team can use a synoptic table to track customer issues and resolutions. The table can include columns for customer name, issue description, assigned support staff, and resolution status. This allows the team to efficiently manage customer issues and ensure timely resolutions.
- Marketing campaigns: A marketing team can use a synoptic table to track their campaigns and results. The table can include columns for campaign name, target audience, channels used, budget, and ROI. This allows the team to evaluate the effectiveness of their campaigns and make data-driven decisions for future marketing efforts.
- Training and development: A team responsible for training and development can use a synoptic table to track employee training progress. The table can include columns for employee name, training modules, completion dates, and scores. This allows the team to quickly identify areas where employees may need additional training and track their progress over time.
How to Create a Synoptic Table Collaboratively with a Team?
-
Open a Creately workspace and share it with your team to collaborate on creating the synoptic table. You can use real-time mouse cursors and synced previews to easily track the changes other participants make in the workspace.
-
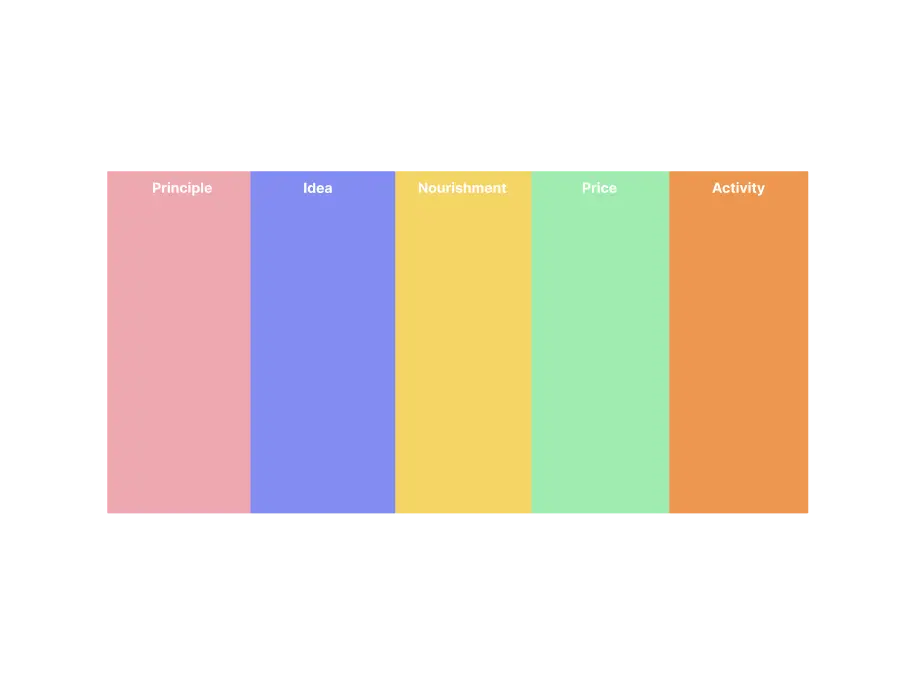
Identify the elements or features that you want to compare and contrast. These will become the columns of your synoptic table. And then identify the options, products, or solutions that you want to compare. These will become the rows of your synoptic table.
-
Create a table using Creately’s intuitive table shape or use a prebuilt synoptic table template. Label the columns with the elements or features you want to compare, and label the rows with the options, products, or solutions.
-
Encourage team members to brainstorm ideas for each option, product, or solution and enter them into the relevant cells of the table.
-
Review the synoptic table to make sure that it is clear and easy to read, and make any necessary adjustments to formatting, such as font size, color, and alignment. Add any additional information or analysis that you think will be useful, such as images, charts, or descriptions using notes. You can easily track any change done to the synoptic table with the version history option.
-
Share the synoptic table by either exporting it in a preferred image format for publishing, embedding, and printing or share a workspace link with edit or review privileges.
Create Synoptic Tables Faster with Premade Templates


FAQs about Synoptic Tables
You can share your synoptic table in multiple ways using Creately. To get a link to embed in a particular site, go to the share option at the top left-hand corner of the workspace. Select ‘embed’ to get the required link.
You can download the workspace as an SVG, PNG, JPEG, or PDF to share. If you want to collaborate and give access to your co-workers to edit, go to collaborators in the share panel and send an invite by including their email. Don’t forget to select the ‘can edit’ option when sending the invite.
Streamline Your Workflows by Integrating with the Tools You Love
Creately integrates with the tools your teams use every day and supports your team’s workflow seamlessly.


Why is Creately a Better Synoptic Table Maker
Creately is the intelligent visual platform enabling visual collaboration, knowledge management and project execution.
100+ proprietary features deliver a flexible, no-code visual platform, expertly-tuned for ease of use.
Infinite Visual Canvas
Visually create and organize any structure you imagine. Drag drop shapes or datasets, embed external content.
Real-Time Collaboration
Work remote or hybrid with realtime cursor tracking, synced previews and proper in-context comments and tasks.
Custom Databases
Create custom databases for any kind of information from tasks, HR personnel records to matters for law firms.
Data Driven Docs
Create docs and notes to go deeper from the high-level visual views. 2 way link to other docs, shapes or data with @mentions.
Professional Diagramming
50+ types of standard diagrams with 1000+ specially designed shapes and connectors enable blazing fast diagramming.
Project & Task Management
Use built-in agile project management tooling or integrate with your favourite project management tool to keep work flowing.
Enterprise Grade Security
ISO 27001, SOC 2 - Type 2, Data Residency & Up-time SLAs to collaborate securely with your entire organization.
Powerful Visual Modelling
Visuals that are backed by databases, update once, reflect in multiple views type of workflows.


Enterprise-Grade Security and Compliance
We’re dedicated to keeping your data private, secure and safe. Creately is SOC2-Type 2 and ISO 27001 certified and GDPR compliant. We offer flexible data residency options in USA, EU and Australia to our enterprise customers.
Just Plug and Play

An easy-to-use interface with a minimal learning curve. Simply Sign-In using your work email to automatically add team members to the enterprise plan.
No installation required.
