Context Diagram Maker
Understand Systems Better
Effectively visualize and clarify the context and boundaries of systems to be modeled.
- Comprehensive data flow and database diagram shape libraries
- Drag and drop interface for easy visualization & modeling
- Multiple context diagram templates to help identify & analyze system flows
Over 10 Million people and 1000s of teams already use Creately


Easy Tools for Faster Systems Design

-
Design easily with simple to use drag-drop tools and Plus Create.
-
Visualize data flows and system processes with multiple context diagram templates.
-
Industry-standard shape libraries for data flows, network diagrams, and more.
-
Highlight and label with configurable color themes and advanced text formatting.

Improve Your Design and Analysis Processes
-
Centralize key details by embedding documents and assets with in-app previews.
-
Capture information. Add docs, attachments, links, and more via the notes panel.
-
Share, review and edit with stakeholders. Use multiple access and role levels.
Collaborate with Your Team, Anytime, Anywhere

-
Gather insights, investigate and create together using built-in brainstorming tools like mind maps.
-
Have discussions and follow-ups on the same canvas with @mention comments.
-
Share with anyone via an email or link invite to collaborate.
-
Streamline reviewing and revising with version history to save and revert back.
INTRODUCING

 Templates
Visualize process and user insights with AI templates

Accessing Creately VIZ
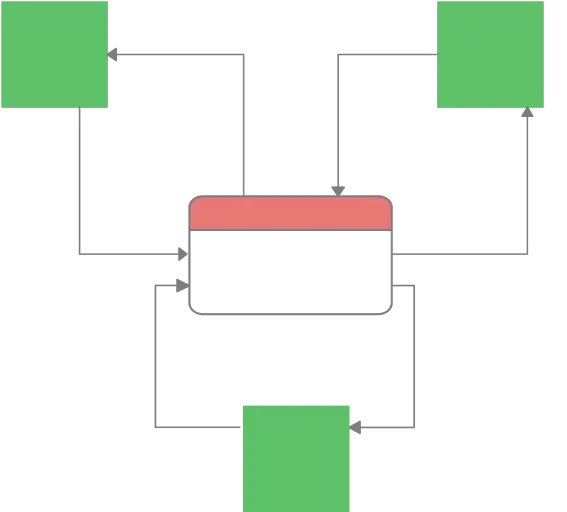
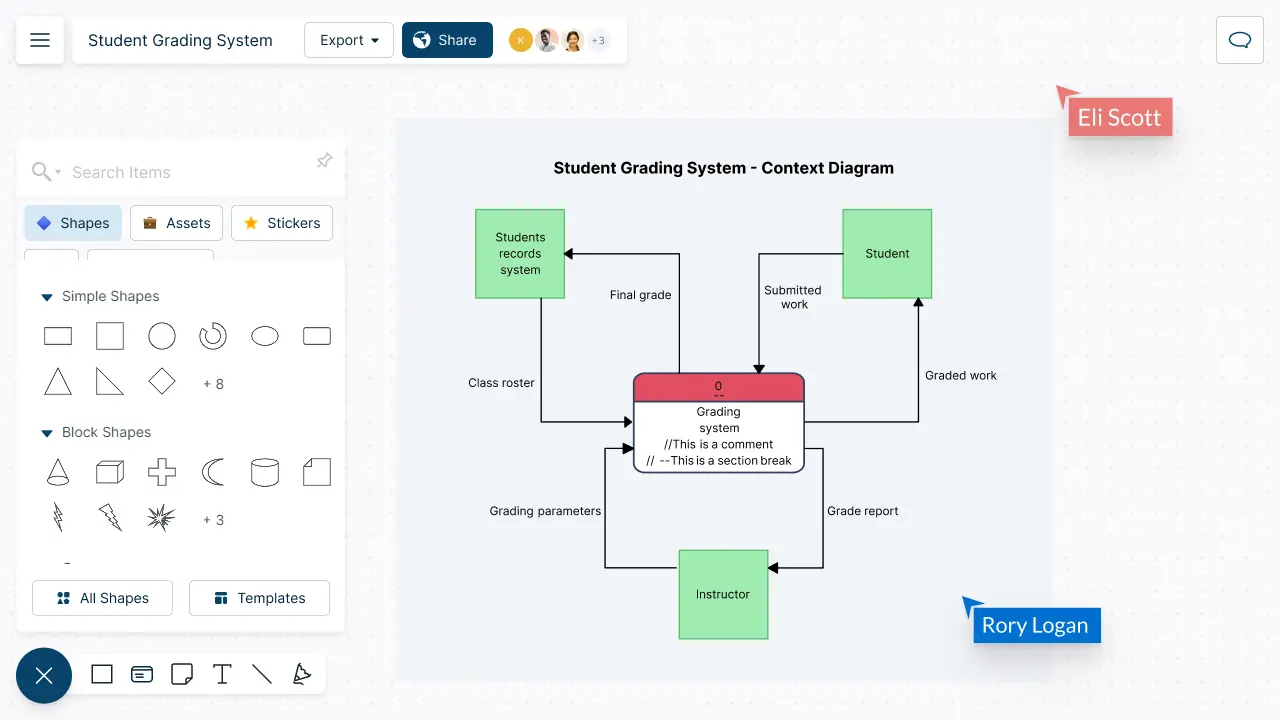
What is a Context Diagram?
How to Create a Context Diagram with Your Team?
- Define the scope of the system
Together with your team, narrow down the main goal or objectives of the system and the external entities that interact with it. Find external entities by identifying the sources and recipients of data-flows that lie outside the system. The actors in use case models you create are often considered as external entities.
Use Creately’s infinite canvas, whiteboard and free-hand drawing capabilities to brainstorm and discuss the project in detail with your team.
- Identify stakeholders
Identify people or groups who have a direct interest or impact on the project. Ask your team members for input. Also note down who will be affected by the system’s design or implementation.
- Gather information
Interview stakeholders, review existing documentation and observe the current system or process, if available, to gather information. Divide the workload among team members. List the major documents and information flows associated with the system, including forms, documents, reference material, and other structured and unstructured information such as emails, telephone conversations, etc.
Use sticky notes and notes panel to include docs as attachments, links, references, special notes, additional data fields, etc. Share a dedicated workspace and folder with the team to include all information.
- Create the context diagram
Apply the information gathered to create the diagram. Add Creately’s data flow shape library or choose a pre-drawn context diagram from the templates library to start customizing immediately. Include and label a process box to represent the entire system. Then add and label the external entities around the outside of the process box. Add the data-flows between the external entities and the system box.
- Review and validate
Share the completed context diagram with team members and stakeholders via a secure link to further investigate and identify areas for improvement. Export it in various image formats including PDF, SVG, PNG, or JPEG or embed them in any site or intranet with a secure embed link for easy access.
- Work together on the design of the system or process
Use the context diagram as a starting point for further discussions and design decisions. Make sure to involve all stakeholders in the design process so that the final design meets the needs of all users.
- Maintain and update the diagram
As the system changes, the team should update the context diagram.
Create Your Context Diagram with Editable Templates


FAQs About Context Diagrams
Context diagrams and data flow diagrams are often used interchangeably, but they aren’t the same. Context diagrams illustrate how external entities interact with your system. It’s the most basic form of a data flow diagram, providing a broad view of the system and external entities in an easy to understand way.
Data flow diagrams contain additional information about a system that a context diagram doesn’t. They focus on how your system works and illustrate the inputs, outputs and processes in much more detail.
There are usually 3 levels of context diagrams.
- Level 0 context diagrams are the highest level of context diagrams and show a system in the context of its environment. They provide a broad overview of the system and its relationships with external entities.
- Level 1 context diagrams are more detailed than level 0 context diagrams, and show more of the internal components of the system. They provide a more detailed view of the system and its interactions with external entities.
- Level 2 context diagrams are even more detailed than level 1 context diagrams, and show the relationships between the internal components of the system in more detail. They provide a very detailed view of the system and its interactions with external entities.
In general, context diagrams can be created at different levels of detail to provide a clear view of the system at different levels of abstraction. The level of detail in a context diagram should be appropriate for the needs of the audience and the purpose of the diagram.
Streamline Your Workflows by Integrating with the Tools You Love
Creately integrates with the tools your teams use every day and supports your team’s workflow seamlessly.


Why is Creately a Better Context Diagram Maker
Creately is the intelligent visual platform enabling visual collaboration, knowledge management and project execution.
100+ proprietary features deliver a flexible, no-code visual platform, expertly-tuned for ease of use.
Infinite Visual Canvas
Visually create and organize any structure you imagine. Drag drop shapes or datasets, embed external content.
Real-Time Collaboration
Work remote or hybrid with realtime cursor tracking, synced previews and proper in-context comments and tasks.
Custom Databases
Create custom databases for any kind of information from tasks, HR personnel records to matters for law firms.
Data Driven Docs
Create docs and notes to go deeper from the high-level visual views. 2 way link to other docs, shapes or data with @mentions
Professional Diagramming
50+ types of standard diagrams with 1000+ specially designed shapes and connectors enable blazing fast diagramming.
Project & Task Management
Use built-in agile project management tooling or integrate with your favourite project management tool to keep work flowing.
Enterprise Grade Security
ISO 27001, SOC 2 - Type 2, Data Residency & Up-time SLAs to collaborate securely with your entire organization.
Powerful Visual Modelling
Visuals that are backed by databases, update once, reflect in multiple views type of workflows.


Enterprise-Grade Security and Compliance
We’re dedicated to keeping your data private, secure and safe. Creately is SOC2-Type 2 and ISO 27001 certified and GDPR compliant. We offer flexible data residency options in USA, EU and Australia to our enterprise customers.
Just Plug and Play

An easy-to-use interface with a minimal learning curve. Simply Sign-In using your work email to automatically add team members to the enterprise plan.
No installation required.
