Donut Chart Maker
Effectively Visualize Your Data
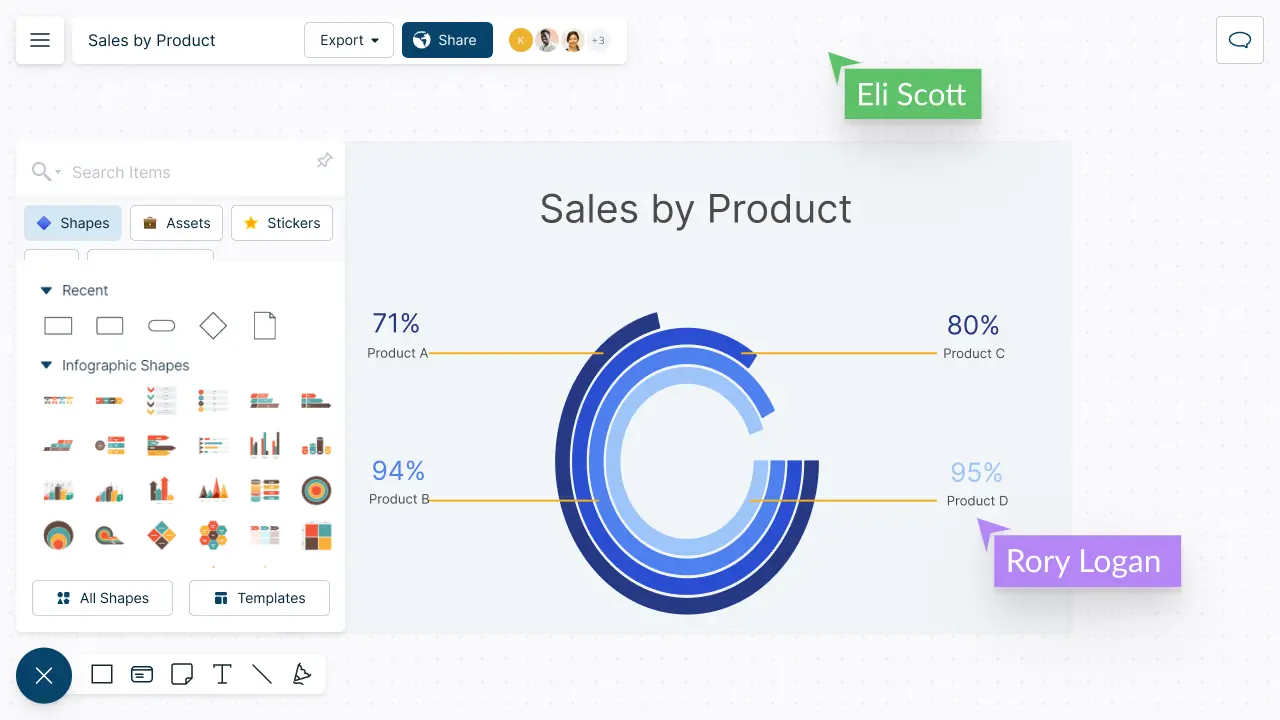
Visually organize your information and data with donut charts. Make data-driven decisions by arranging data and interacting with it with your team.
- Intuitive donut chart shape to quickly visualize data
- In-built presentation tools to present data or survey findings
- Pre-designed scenario-based templates to get a headstart
Over 10 Million people and 1000s of teams already use Creately


Find Better Insights Faster
-
Import and export data and keep them synced with multiple app integrations.
-
Bring data as CSV, Excel files or spreadsheets to visualize as donut charts and more.
-
Add docs, attachments and links to each slice of your donut chart using the notes panel.
-
Create interactive presentations, dashboards, and reports with built-in tools.
Create a Holistic View of Your Data

-
Customize and highlight data patterns using color themes and text formatting.
-
Visualize over 50 types of diagrams complete with specialized shapes and icon libraries.
-
Illustrate a variety of scenarios with professionally-designed doughnut chart templates.
-
Easily navigate and locate information in complex data visuals using universal search.

Make Collaborative Decisions Based on Data
- Collaborate and create charts with real-time cursors for any number of participants.
- Share instant feedback. Comment and have discussions on the same canvas. Keep track of key points added to the charts with full version history.
- Export and share donut charts with your teams as PNGs, JPEGs, SVGs, or PDFs or embed on a site or intranet with a secure link.
INTRODUCING

 Templates
Visualize process and user insights with AI templates

Accessing Creately VIZ

What is a Donut Chart?
How to Create a Doughnut Chart with Your Team in Creately?
- Gather the information you need
As the first step, gather the information you need. This can include categories, values, and any other relevant details.
- Prepare the data or information
Once you have the required information, organize and prepare it in a way that your team can easily understand. Sort data by category, calculate percentages or create labels.
Once ready, import the relevant CSV or Spreadsheet to the canvas. You can also use Creately’s powerful and customizable table option to categorize and organize data for easy reference and analysis with your team.
- Create the chart
Select a doughnut chart template from Creately’s template library or draw one from scratch using Creately’s doughnut chart shape. Style your doughnut chart using the shape settings and add key data for each element on the chart using the data panel as necessary. Make sure to create a legend for the chart as well.
- Share, review and discuss
Share the doughnut chart with your team to review and edit. Together, fine-tune and discuss improvements or missing information, if any.
You can also share the workspace with stakeholders and clients. Use the appropriate permission settings to ensure they can access the chart. Use Creately’s integrations with Microsoft Teams to conduct seamless meetings from anywhere.
Find changes made by collaborators using multi-cursors on the canvas in real-time or via the version history. If you want to revert to a previous iteration, select the version to apply the changes.
- Finalize and embed
Once finalized, use Google/Microsoft add-ons, embed the donut chart in an email or website, or export in various formats, including PNG, SVG, PDF, JPEG, and many more.
Create Donut Charts Online with Editable Templates


FAQs About Donut Charts
Streamline Your Workflows by Integrating with the Tools You Love
Creately integrates with the tools your teams use every day and supports your team’s workflow seamlessly.


Why is Creately a Better Donut Chart Maker
Creately is the intelligent visual platform enabling visual collaboration, knowledge management and project execution.
100+ proprietary features deliver a flexible, no-code visual platform, expertly-tuned for ease of use.
Infinite Visual Canvas
Visually create and organize any structure you imagine. Drag drop shapes or datasets, embed external content.
Real-Time Collaboration
Work remote or hybrid with real-time cursor tracking, synced previews and proper in-context comments and tasks.
Custom Databases
Create custom databases for any kind of information from tasks, HR personnel records to matters for law firms.
Data Driven Docs
Create docs and notes to go deeper from the high-level visual views. 2 way link to other docs, shapes or data with @mentions.
Professional Diagramming
50+ types of standard diagrams with 1000+ specially designed shapes and connectors enable blazing fast diagramming.
Project & Task Management
Use built-in agile project management tooling or integrate with your favourite project management tool to keep work flowing.
Enterprise Grade Security
ISO 27001, SOC 2 - Type 2, Data Residency & Up-time SLAs to collaborate securely with your entire organization.
Powerful Visual Modelling
Visuals that are backed by databases, update once, reflect in multiple views type of workflows.


Enterprise-Grade Security and Compliance
We’re dedicated to keeping your data private, secure and safe. Creately is SOC2-Type 2 and ISO 27001 certified and GDPR compliant. We offer flexible data residency options in USA, EU and Australia to our enterprise customers.
Just Plug and Play

An easy-to-use interface with a minimal learning curve. Simply Sign-In using your work email to automatically add team members to the enterprise plan.
No installation required.
